Over the years, I’ve seen the Shooting Star appear at key market tops across forex, stocks, and even crypto. But here’s the thing — recognizing the pattern is just the beginning. If you don’t understand the market context, wait for confirmation, or apply proper risk management, this pattern can lead to false confidence and costly trades.
In this guide, I’ll walk you through everything I’ve learned about the Shooting Star, including:
-
- How to spot it — and how not to be fooled by lookalikes
- Why it forms and what it tells us about buyer/seller psychology
- How I personally trade it, step by step
- Mistakes I’ve made (so you don’t have to)
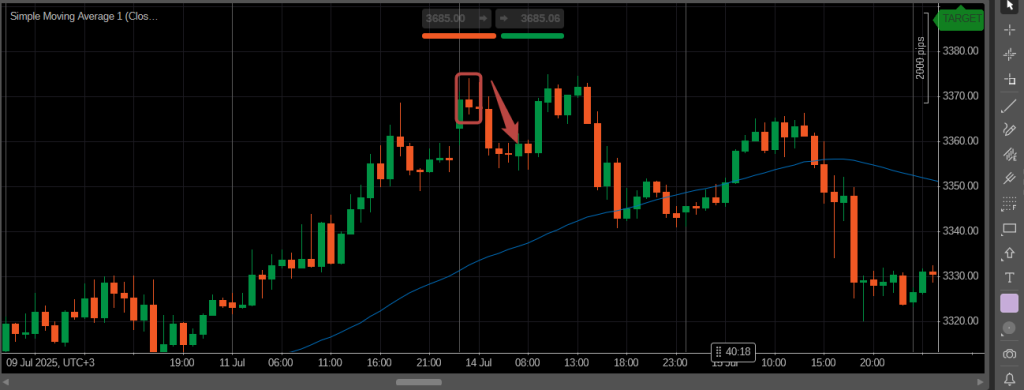
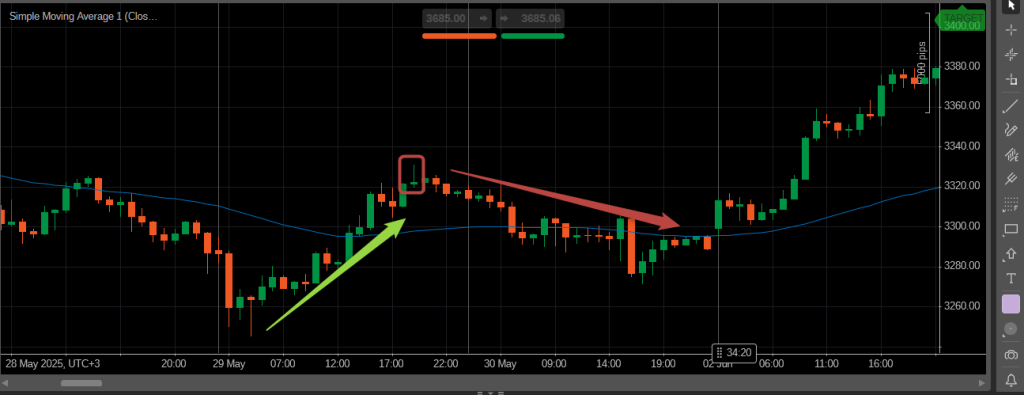
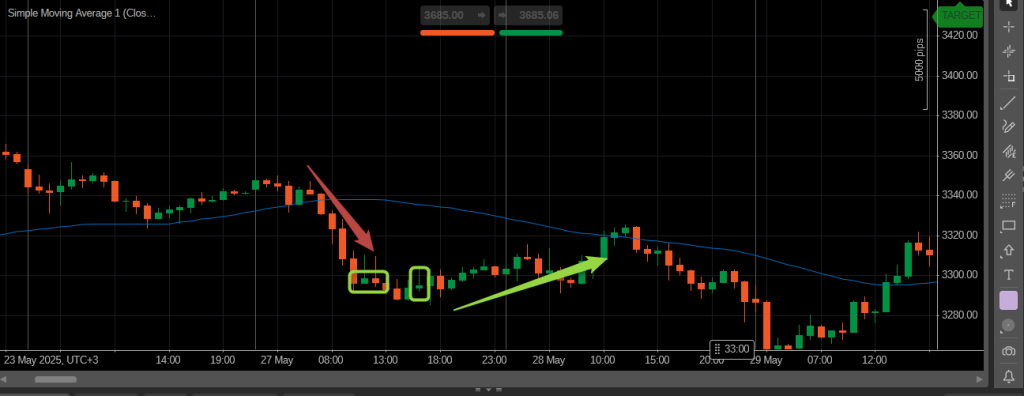
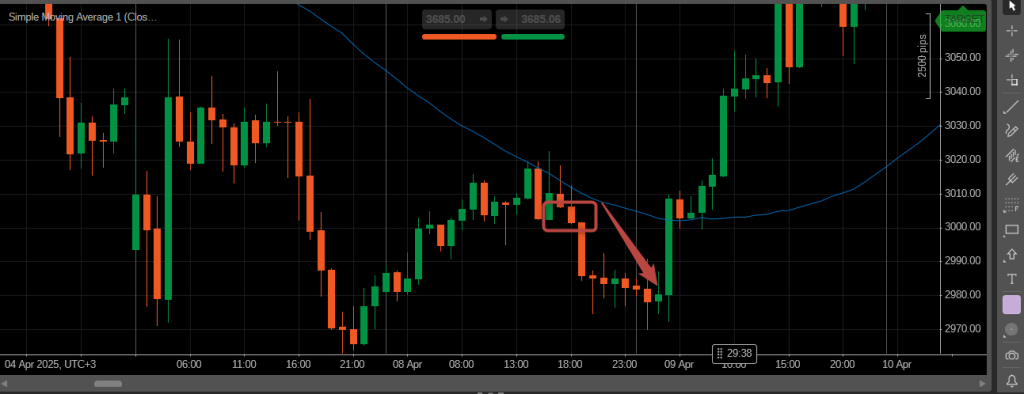
- Real chart examples across different timeframes and markets
Whether you’re still building your trading foundation or refining your entry setups, mastering this candlestick pattern can give you a clear visual edge in spotting potential tops — before they roll over.
Let’s get started.
What Is a Shooting Star Candlestick?
One of the first candlestick patterns I learned to recognize was the Shooting Star, and it’s still one of the most useful reversal signals in my technical analysis toolbox.
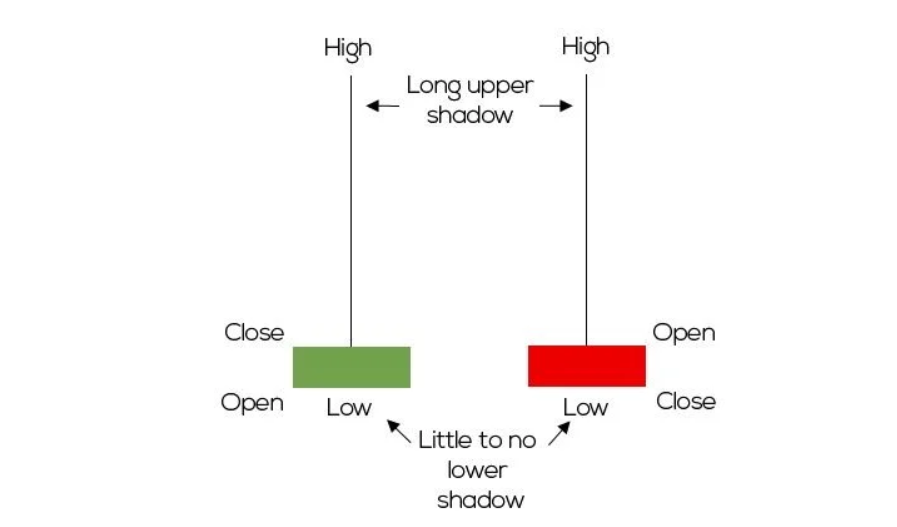
A Shooting Star candlestick is a bearish reversal pattern that typically appears after an uptrend. It’s defined by a small real body near the bottom of the candle, a long upper wick, and little or no lower shadow. What that tells me is that buyers pushed the price higher, but by the time the candle closed, sellers had taken control and driven the price back down. That kind of price action signals weakening bullish momentum.
Key Characteristics I Look For
To qualify as a proper Shooting Star, the candle should meet a few criteria:
-
- It must form after a clear upward move — this candlestick pattern only makes sense at or near the top of an uptrend.
- The upper wick should be at least twice the length of the body, showing that buyers were aggressively pushing higher before losing control.
- The body is small, and should ideally close near the low of the candle.
- There should be little to no lower wick, reinforcing the rejection of higher prices.
Why the Shooting Star Matters
The power of this pattern comes from the psychology behind it. When I see a Shooting Star at the top of a strong move, I interpret it as a sign that buyers are exhausted and that sellers are starting to step in. It’s a red flag that the current trend might be losing steam, especially if it occurs at a key resistance level or after a parabolic rally.
That said, I’ve learned not to jump into a short trade the moment I see this pattern. Without proper market context or Shooting Star confirmation, it can lead to false signals. Later in this guide, I’ll show you how I confirm Shooting Star setups before taking action.
How to Identify the Shooting Star Pattern
Over time, I’ve learned that properly identifying a shooting star candlestick isn’t just about spotting a candle with a long upper wick. The pattern is only meaningful when it’s in the right context and when it meets some very specific criteria.
Visual Checklist for the Shooting Star Candlestick
Here’s what I personally look for before labeling any candle as a shooting star:
-
- It appears after an uptrend, this is essential. The shooting star is a bearish reversal candlestick pattern, so it only carries weight when it forms after a clear bullish move.
- The upper shadow is long, ideally, the upper wick should be at least twice the length of the real body. This tells me that buyers tried to drive the price much higher but failed to hold those gains.
- The real body is small and near the low. this shows the price closed near the session low, which signals that selling pressure overcame the earlier bullish push.
- Little or no lower shadow. This reinforces the idea that there was no real bounce after the selling came in. For me, the cleaner the wick structure, the more reliable the signal.
Importance of Shooting Star Confirmation
One of the biggest mistakes I made early on was trading the pattern without confirmation. Sometimes, a candle looks like a shooting star, but price continues to climb the next day. That’s why I almost always wait for a bearish confirmation candle, something like a red candle that closes below the shooting star’s low, before entering a trade.
I also look at what else is happening on the chart. Is the shooting star pattern forming at resistance? Is it aligned with divergence on an RSI or overbought conditions? These factors help me determine whether the pattern has high probability or is just noise.
Best Timeframes for Spotting the Pattern
In my experience, the shooting star candlestick is most effective on the daily, 4-hour, and 1-hour charts. While it can appear on shorter timeframes like 15-minute charts, I’ve found that lower timeframes often produce more false signals, especially in volatile markets like crypto or during news events in forex.
Shooting Star vs Inverted Hammer: Key Differences
When I first started learning candlestick patterns, I used to confuse the shooting star with the inverted hammer. They look almost identical, with both having long upper wicks, small bodies, and very little lower shadows. However, despite their visual similarities, they appear in completely different contexts and suggest opposite market reactions.
Here’s how I differentiate between them.
Context Is Everything
The shooting star appears after an uptrend. That’s a major clue. It signals that buying momentum may be fading and that a bearish reversal could be around the corner. When I see a shooting star after several strong bullish candles or near a key resistance level, I start preparing for a potential move down, especially if confirmation follows.
The inverted hammer, on the other hand, appears after a downtrend. While it may look the same on the chart, it actually represents a potential bullish reversal. The psychology behind it is different: sellers push the price lower during a downtrend, but buyers suddenly step in and push it back up. If the next candle confirms this shift with a strong bullish close, the inverted hammer can signal the beginning of a move higher.
My Personal Approach to Avoiding Confusion
Now, whenever I see a candle with a long upper wick and a small body, I ask myself one question before labeling it: What came before it? If the market has been trending up, I treat it as a potential shooting star. If it’s been trending down, I consider the inverted hammer, but only if the follow-up candle confirms it.
I’ve also learned not to jump in based on the candle shape alone. I always wait for the next candle and look at where the pattern formed. Both the shooting star and inverted hammer need the right environment to work, and that’s what gives them their edge.
How to Trade the Shooting Star Candlestick
Over time, I’ve developed a set of rules for trading the shooting star candlestick pattern effectively. It’s not just about spotting the pattern, it’s about understanding how to confirm the signal, manage risk, and maximize potential. Here’s how I approach it.
Step 1: Wait for Confirmation
When I spot a shooting star, I never enter the market immediately. The pattern itself is a potential reversal signal, but without confirmation, it can be a false alarm. I always wait for the next candle to close below the low of the shooting star. This confirms that the selling pressure is real and that the pattern has merit.
If the next candle closes above the shooting star’s high, I simply move on. The setup has failed, and I don’t take the trade.
Step 2: Check for Support or Resistance Levels
Before I commit to the trade, I look at where the shooting star is forming. If it’s near a key resistance level (such as a trendline, previous swing high, or Fibonacci level), the pattern has a higher chance of success. A shooting star at the top of an uptrend is far more significant when it aligns with a well-established resistance zone.
I’ve learned that if the pattern forms in the middle of nowhere, with no significant price action support or resistance nearby, the probability of a successful reversal is much lower.
Step 3: Manage Your Risk
Whenever I take a trade, I’m mindful of risk management. After entering on a valid shooting star signal, I place my stop loss just above the high of the shooting star candle. This way, if the market moves against me, my loss is limited.
I also try to maintain a good risk-to-reward ratio. Aiming for at least 2:1 (reward:risk) is a rule of thumb I follow. So, if my stop loss is 30 pips, I look for a target of 60 pips or more, depending on the market’s volatility.
Step 4: Set Realistic Profit Targets
For my profit targets, I typically look at nearby support levels or previous swing lows. If the market continues to show strong selling pressure after the shooting star pattern, I trail my stop to lock in profits while giving the trade room to develop.
It’s essential to remember that not every shooting star leads to a massive reversal. I stay flexible and monitor the trade actively, adjusting my targets if needed.
Step 5: Keep the Bigger Picture in Mind
Finally, I always check the overall trend. The shooting star is a reversal pattern, but if the market has been in a strong uptrend for a while, it may just be a temporary pullback rather than the start of a new trend. That’s why I prefer to use shooting stars as part of a larger trading strategy — not as a standalone signal.
I also like to combine this pattern with other technical indicators or chart patterns to give me more conviction in my trade decision.
Common Mistakes to Avoid When Trading the Shooting Star
Trading the shooting star can be highly effective, but like any candlestick pattern, it’s easy to make mistakes if you’re not careful. Over time, I’ve learned to avoid these common pitfalls that can make a shooting star signal less reliable or even lead to losses.
Mistake 1: Ignoring Market Context
The biggest mistake I made early on was ignoring the market context in which the shooting star formed. A shooting star on its own can look tempting, but it’s not as powerful unless it appears after a clear uptrend. Without a strong bullish move leading up to the shooting star, it’s just another candlestick pattern with little significance.
For example, if I spot a shooting star in the middle of a sideways market or during choppy price action, it’s likely to fail. The pattern’s effectiveness comes from the momentum shift it signals. If there’s no trend behind it, the reversal may not happen.
Mistake 2: Entering Too Early
I used to enter trades too quickly after spotting a shooting star. Just because I see the pattern doesn’t mean the market will automatically follow through with the expected reversal. The shooting star is a potential signal, not a guarantee.
I’ve learned to wait for confirmation, such as the next candle closing below the low of the shooting star. Sometimes, price action may continue upward despite the pattern. Waiting for confirmation helps me filter out the false signals.
Mistake 3: Overlooking the Importance of Resistance
Another mistake I made was not paying enough attention to resistance levels when trading shooting stars. A shooting star near key resistance is far more reliable than one formed in a random location. Without a significant resistance point, the shooting star may be just a brief pullback rather than a strong reversal.
Now, I make sure the shooting star is forming near previous swing highs, Fibonacci levels, or other price action levels. These levels act as a magnet for price and can make the shooting star much more likely to mark the end of the uptrend.
Mistake 4: Not Managing Risk Properly
Risk management was a challenge for me in the beginning. The shooting star pattern can be an excellent signal, but the market can still move against me. I’ve had moments where I didn’t use a proper stop loss, which resulted in larger losses than I anticipated.
Now, I always place my stop just above the high of the shooting star. This ensures that I’m not exposed to a full-scale trend reversal if the market turns back in favor of the bulls. I also keep my risk-to-reward ratio in mind, aiming for at least 2:1 to make sure that my potential profit outweighs the risk.
Mistake 5: Neglecting to Monitor the Follow-Up Candle
I used to get impatient and assume that the shooting star would lead to a major reversal. However, the next candle could completely negate the pattern. Confirmation is key — the next candle needs to confirm the bearish reversal by closing below the shooting star’s low.
If that confirmation doesn’t come, the shooting star can easily turn into a false signal, and I risk losing money by prematurely entering a trade. Patience is important when trading reversal patterns like the shooting star.
Mistake 6: Trading Without a Bigger Strategy
Finally, I’ve learned that relying on the shooting star pattern alone isn’t enough. I used to trade it as a standalone strategy, but that often led to poor results. The shooting star is just one piece of the puzzle. I always use it in conjunction with my larger trading plan, which includes market structure, trend analysis, and other tools like technical indicators or price action analysis.
I’ve found that combining the shooting star with a clear trend or other confirmation signals increases my chances of a profitable trade.
Conclusion and Final Thoughts on Trading the Shooting Star
Trading the shooting star can be incredibly effective when used correctly. Over the years, I’ve found that it’s not just about recognizing the candlestick pattern, but understanding its role within the broader market context and following a set of clear steps to manage risk and confirm the signal.
The shooting star is a powerful reversal pattern, but it’s not foolproof. It requires confirmation, proper market context, and a well-defined risk management strategy. If I’m patient and disciplined, the shooting star often gives me an edge in spotting potential trend shifts at key levels of resistance.
However, like any other pattern, it’s essential to avoid common mistakes, like jumping in too early, ignoring confirmation, or trading without considering the bigger picture. By incorporating the shooting star into a broader trading plan and combining it with other technical analysis tools, I increase my chances of success and minimize my exposure to unnecessary risks.
In the end, no pattern is a guarantee, but with practice and attention to detail, the shooting star can be a valuable tool in my trading toolkit. By staying patient, sticking to my strategy, and continuously learning from my experiences, I’ve found that the shooting star can be an effective way to identify potential reversals and capitalize on market trends.


