In trading, price charts often reveal patterns that signal what might happen next. Among the most recognized and reliable formations are the double top and double bottom patterns. These classic trend reversal signals have been used by traders for decades in markets ranging from forex and stocks to cryptocurrencies.
The beauty of these patterns lies in their simplicity: they are easy to spot, easy to understand, and, when applied with discipline, can become powerful tools in any trader’s strategy. A double top pattern often warns of a bearish reversal after a strong upward move, while a double bottom pattern suggests the market could be preparing for a bullish turnaround.
In this article, we’ll break down what these patterns look like, how to identify them correctly, and the strategies you can use to trade them with confidence. Whether you’re a beginner exploring technical analysis or an experienced trader looking to sharpen your price action skills, mastering these patterns can give you an edge in spotting market reversals early.
What is a Double Top Pattern?
The double top pattern is a chart formation that signals a potential bearish reversal. It usually appears after a strong upward trend when the price reaches a peak, pulls back, and then rises again to a similar level before falling once more. This creates two distinct peaks at roughly the same price level, forming the “double top.”
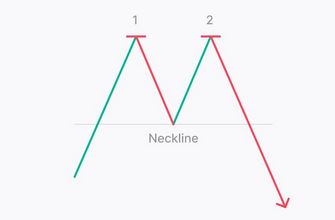
The key to confirming this pattern lies in the neckline. The neckline is the horizontal support line drawn at the lowest point between the two peaks. Once the price breaks below this neckline, it signals that sellers have taken control, and a downward trend is likely to follow.
Traders often view the double top as one of the most reliable reversal patterns because it reflects a clear shift in market sentiment: buyers fail to push the price higher after the second attempt, and sellers step in to reverse the direction.
This pattern can be found across different markets, including forex, stocks, and cryptocurrencies, and it works well on higher timeframes where signals are generally stronger.
What is a Double Bottom Pattern?
The double bottom pattern is the bullish counterpart of the double top. It forms after a strong downward trend when the price falls to a low point, rebounds, and then retests a similar low before moving upward again. This creates two clear troughs at nearly the same price level, which resemble the shape of a “W.”
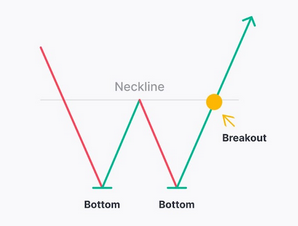
The neckline in a double bottom is drawn across the peak between the two lows. When the price breaks above this neckline, it confirms the reversal and signals that buyers have regained control of the market.
This pattern is widely respected among traders because it reflects a shift in momentum. Sellers attempt to push the price lower twice but fail both times, showing that demand is strong at that support level. As a result, the breakout above the neckline often leads to sustained upward movement.
Double bottoms are frequently observed in major assets like Bitcoin, Ethereum, and traditional markets, and they tend to be more reliable when seen on higher timeframes such as the 4-hour, daily, or weekly charts.
How to Identify Double Top and Double Bottom Patterns Correctly
Spotting these reversal patterns might seem simple at first glance, but accuracy is key if you want to avoid false signals. Here are the main steps traders follow:
-
- Look for a Clear Trend. A double top forms after an uptrend, while a double bottom forms after a downtrend. If there is no clear prior trend, the pattern may be less reliable.
- Check the Symmetry. Both peaks in a double top or both troughs in a double bottom should occur at roughly the same price level. Minor differences are normal, but large gaps reduce the validity of the pattern.
- Confirm with the Neckline Breakout. The most important signal is the price breaking through the neckline. Without this breakout, the formation remains incomplete, and the market may continue in its original direction.
- Volume as a Supporting Factor. In many cases, volume decreases during the formation of the second top or bottom and rises sharply during the neckline breakout. This provides additional confirmation of the trend reversal.
- Timeframe Matters. Patterns on longer timeframes (4-hour, daily, or weekly charts) tend to be more reliable than those on very short timeframes, where market noise can create false patterns.
By carefully applying these rules, traders can distinguish valid double tops and bottoms from random price fluctuations, improving their chances of entering at the right moment.
Trading Strategies for Double Top and Double Bottom Patterns
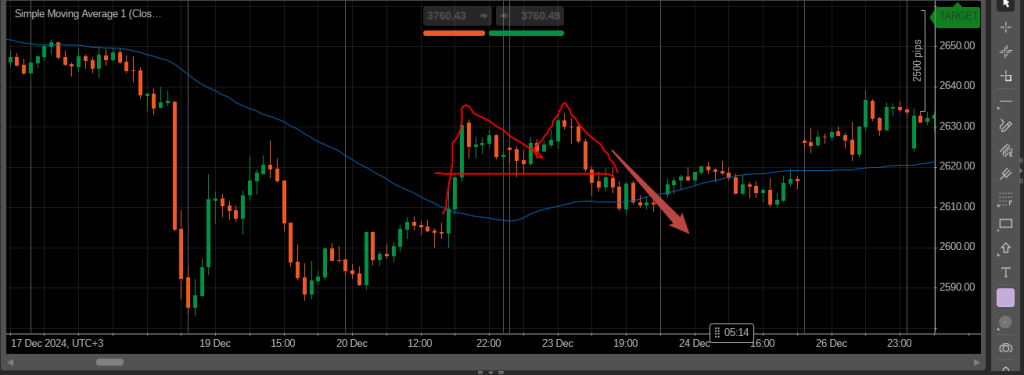
For a double top, traders usually enter a short position once the price breaks below the neckline. Stop-loss orders are typically placed slightly above the second peak to protect against false breakouts. Profit targets can be estimated by measuring the distance between the peaks and the neckline and subtracting that from the breakout point. Volume, RSI, and moving averages can provide additional confirmation, and waiting for a retest of the neckline after the breakout can help reduce the risk of entering on a false signal.
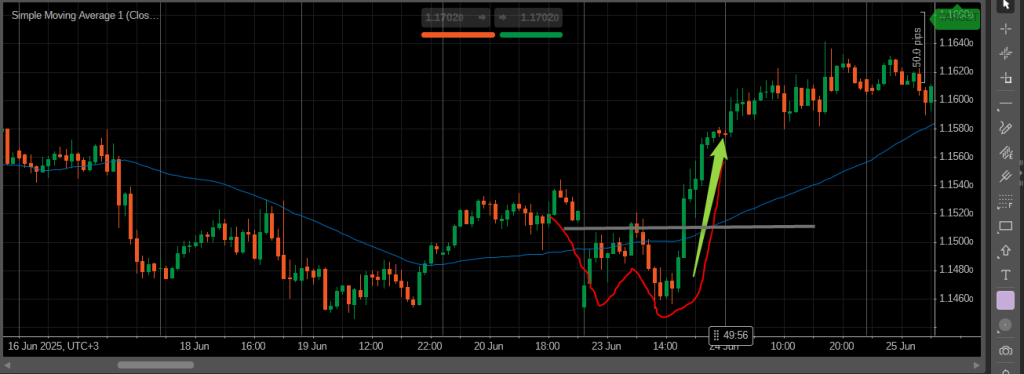
For a double bottom, traders generally open a long position after the price breaks above the neckline. Stop-loss orders are usually placed slightly below the second trough to limit potential losses. Profit targets can be calculated by measuring the distance between the troughs and the neckline and adding it to the breakout point. Confirmation using volume, RSI, and moving averages can improve accuracy, and waiting for a retest of the neckline after the breakout can increase the chances of a successful trade.
By carefully applying these strategies with disciplined entry, stop-loss placement, and profit-taking rules, traders can effectively use double top and double bottom patterns to spot trend reversals.
Common Mistakes and False Signals
Even experienced traders can fall into traps when trading double top and double bottom patterns. Understanding these mistakes can help reduce losses and improve the accuracy of your trades.
For Double Top Patterns:
-
- Entering too early: Many traders try to short the market before the neckline is broken, which can result in a failed trade if the price rebounds.
- Misidentifying peaks: Small fluctuations may appear as a second peak, but if the peaks are not roughly at the same level, the pattern is less reliable.
- Ignoring volume confirmation: A proper double top is often accompanied by decreasing volume on the second peak and increasing volume on the breakout. Ignoring this signal can lead to false entries.
- Placing stop-losses incorrectly: Placing stop-losses too close or too far from the second peak can either trigger unnecessary exits or increase risk.
- Relying solely on the pattern: Double tops work best when confirmed with other indicators like RSI, moving averages, or trend lines. Ignoring confirmation can result in false signals.
For Double Bottom Patterns:
-
- Entering too early: Opening a long position before the price breaks above the neckline increases the risk of being trapped in a false breakout.
- Misjudging troughs: The two troughs should be at similar levels. If the second trough is much lower or higher, the pattern may not signal a reversal.
- Neglecting volume and momentum: Decreasing volume during the second trough and increasing volume at the breakout are key confirmations. Overlooking this can lead to failed trades.
- Improper stop-loss placement: Putting stop-losses too close may trigger exits during minor retracements, while placing them too far can increase potential losses.
- Ignoring market context: Double bottoms are stronger in a clear downtrend. Trading without considering the overall trend can reduce the reliability of the pattern.
By paying attention to these points and combining proper confirmation methods, traders can avoid common pitfalls and make the most of double top and double bottom patterns.
Double Top and Double Bottom in Different Markets
Double top and double bottom patterns are versatile and can be applied across multiple markets, but their reliability and behavior can vary depending on the asset and market conditions.
In Forex Trading:
-
- Double tops often appear after a strong currency pair rally, signaling a potential bearish reversal. For example, EUR/USD may form a double top after reaching a significant resistance level.
- Double bottoms frequently occur after a sustained downtrend, indicating a possible bullish reversal. Traders often look for confirmation with indicators such as RSI or MACD.
- Forex markets are highly liquid, making it easier to spot clear patterns, but sudden news events can still trigger false breakouts.
In Cryptocurrency Trading:
-
- Double tops can appear during rapid upward surges in Bitcoin, Ethereum, or other altcoins, signaling that buyers may be losing momentum.
- Double bottoms may form after steep sell-offs, indicating that buyers are starting to regain control.
- Crypto markets are 24/7 and highly volatile, which means patterns can form quickly but are sometimes less reliable due to sudden market spikes.
- Using confirmation tools like volume, trend lines, and moving averages is essential to reduce the risk of false signals.
In Stock Trading:
-
- Double tops in stocks often indicate that the price has reached strong resistance after a bullish trend and a reversal could follow. Traders look for confirmation with volume spikes or support levels.
- Double bottoms can form after extended downtrends, signaling potential bullish reversals in individual stocks or indices.
- Stocks tend to have more stable price behavior compared to crypto, which can make patterns slightly more reliable on daily or weekly charts.
Understanding how double top and double bottom patterns behave in different markets helps traders adjust their strategies and risk management. Combining pattern recognition with market-specific tools and indicators improves the chances of successful trades.
Advantages and Limitations of Double Top and Double Bottom Patterns
Double top and double bottom patterns are popular among traders because of their simplicity and effectiveness, but they also have limitations. Understanding both sides helps traders use them more effectively.
Advantages:
-
- Simplicity: These patterns are easy to spot on charts and can be quickly understood even by beginners.
- Clear Entry and Exit Points: The neckline provides a natural level for setting entries, stop-losses, and profit targets.
- Reliable Trend Reversal Signals: When confirmed by volume or other indicators, these patterns often provide early warnings of market reversals.
- Versatility Across Markets: They can be applied in forex, cryptocurrency, and stock trading, making them useful for multiple trading strategies.
- Works with Other Technical Tools: They can be combined with RSI, moving averages, or trendlines to increase accuracy.
Limitations:
-
- False Breakouts: Not every formation leads to a reversal; sometimes the price returns to the previous trend after a failed breakout.
- Requires Confirmation: Relying solely on the pattern without additional indicators increases risk.
- Timeframe Sensitivity: Patterns on very short timeframes can be less reliable due to market noise.
- Moderate Profit Potential: The measured move may not always reach the target, especially in choppy or sideways markets.
- Psychological Pressure: Waiting for confirmation and dealing with false signals can be stressful, particularly for new traders.
By understanding these advantages and limitations, traders can better integrate double top and double bottom patterns into their overall trading strategy and manage risks effectively.
Tips for Beginners Using Double Top and Double Bottom Strategies
Trading double top and double bottom patterns can be challenging for beginners, but following a few practical tips can increase the chances of success.
-
- Focus on Liquid Assets: Start with highly traded forex pairs, major stocks, or popular cryptocurrencies like BTC or ETH. Liquid markets reduce slippage and make patterns easier to spot.
- Use Higher Timeframes: Patterns are generally more reliable on 4-hour, daily, or weekly charts. Avoid relying solely on very short-term charts where noise can create false signals.
- Practice on Demo Accounts: Before risking real money, practice identifying patterns and executing trades on a demo account. This helps build confidence and experience.
- Wait for Confirmation: Always wait for the price to break the neckline and consider retests or supporting indicators like volume, RSI, or moving averages before entering a trade.
- Set Clear Stop-Loss and Profit Targets: Discipline in risk management is essential. Determine your stop-loss and take-profit levels before entering a trade.
- Avoid Overtrading: Focus on quality setups rather than trying to trade every formation. Patience improves success rates.
- Combine with Other Technical Tools: Use trendlines, moving averages, and oscillators to confirm the pattern and improve trade accuracy.
Following these tips helps beginners reduce mistakes and gradually develop the skills needed to trade double top and double bottom patterns effectively.
Conclusion
Double top and double bottom patterns are powerful tools for spotting potential trend reversals in various markets, including forex, stocks, and cryptocurrencies. By learning to identify these patterns correctly and combining them with proper confirmation tools, traders can improve the accuracy of their entries and exits.
While these patterns are simple and versatile, they are not foolproof. False breakouts and minor fluctuations can create misleading signals, so it is essential to practice disciplined risk management, set clear stop-loss and profit targets, and use supporting indicators.
For beginners, starting with liquid assets, practicing on demo accounts, and focusing on quality setups rather than quantity can build confidence and trading skills. Experienced traders can use these patterns to enhance existing strategies and refine decision-making in both trending and reversing markets.
Mastering double top and double bottom patterns can provide a reliable foundation for technical analysis, helping traders make informed decisions and capitalize on market reversals with greater confidence.


