Fakeouts, or false breakouts, are among the most frustrating situations traders face in the financial markets. Imagine seeing a strong breakout above resistance or below support, entering the trade with confidence, only to watch the price reverse in the opposite direction. This common market trap not only causes losses but also erodes trader confidence.
In the fast-paced world of high-frequency trading, such as scalping or intraday strategies, fakeouts can happen within seconds or minutes. Traders who rely on short-term price movements and quick entries are especially vulnerable, as volatility and liquidity shifts often create deceptive signals. A single false move can quickly wipe out multiple small gains.
Meanwhile, low-frequency traders—those who prefer swing trading or long-term positions—are not immune either. On higher timeframes, false breakouts can trick traders into holding losing positions for days or even weeks. A fake breakout of a major support or resistance level can trigger stop-losses, force early exits, or lead to missed opportunities when the market resumes its real trend.
That’s why mastering the art of spotting and filtering fakeouts is a must for every trader, regardless of their style. In this article, we’ll break down the mechanics of fakeouts, explain the psychological and institutional factors behind them, and provide actionable strategies using indicators, candlestick patterns, and volume analysis. Whether you are a scalper looking for high-frequency trades or a swing trader managing low-frequency opportunities, this guide will help you avoid costly traps and trade with more confidence.
What is a Fakeout?
A fakeout, also known as a false breakout, occurs when the price moves beyond a well-defined support or resistance level, giving the impression of a new trend, but then quickly reverses direction. Traders often mistake this movement for the start of a breakout, only to be caught off guard when the market turns back.
For example, in a bullish fakeout, the price may briefly rise above resistance, encouraging buyers to enter. However, instead of continuing upward, the price falls back below the resistance, trapping those traders in losing positions. Conversely, a bearish fakeout happens when the price dips below support, only to recover and rise again.
Fakeouts are a natural part of both high-frequency and low-frequency markets. In high-frequency trading, fakeouts often appear during periods of thin liquidity, news-driven spikes, or algorithmic manipulation. For low-frequency traders, fakeouts usually occur around key levels on higher timeframes, often triggered by institutional players hunting stop-loss orders before resuming the primary trend.
Understanding how and why fakeouts occur is the first step toward building strategies that protect your capital and improve your trading edge.
Why Do Fakeouts Happen?
Fakeouts are not random; they are driven by specific market dynamics that trap traders into making emotional decisions. Understanding these factors can help you avoid unnecessary losses and spot better opportunities.
-
- Liquidity hunting. Large players such as institutions or market makers often push the price beyond obvious support or resistance levels to trigger stop-loss orders. This creates temporary liquidity for them to enter or exit larger positions before the market resumes its true direction.
- Market psychology. Traders are naturally drawn to breakouts because they signal strong momentum. When the price pierces a key level, many jump in quickly, expecting continuation. This herd behavior fuels fakeouts, as early entries create a pool of liquidity that bigger players exploit.
- News and volatility. Economic releases or unexpected news can generate sharp spikes that appear to confirm a breakout. However, once the initial reaction fades, the market often snaps back, leaving breakout traders trapped in losing positions.
- Thin liquidity periods. During low-volume sessions (for example, after the US market closes), even small orders can move the market significantly, causing fakeouts around technical levels.
In both high-frequency and low-frequency environments, these drivers amplify uncertainty. Recognizing these triggers allows traders to remain cautious and avoid falling into traps that wipe out gains.
How to Identify Fakeouts
Spotting a fakeout requires a careful eye and patience. One of the most reliable clues comes from candlestick patterns. Certain formations, like pin bars, hammers, and engulfing candles, can hint that a breakout may not have the strength to continue. For example, if price breaks above a resistance level but forms a small upper wick or a long-tailed candle, this could be an early warning of a false breakout. Traders often call this a “breakout trap,” where the initial momentum is quickly reversed, leaving those who entered too early on the losing side.
Volume also plays a critical role in identifying fakeouts. A genuine breakout typically shows increasing volume, confirming that market participants are supporting the move. In contrast, when price moves beyond support or resistance but volume remains low, the probability of a reversal rises. Low-frequency keywords like “fakeout confirmation” and “breakout failure signals” are particularly relevant here, as they describe the subtler signals that distinguish a true breakout from a fake one.
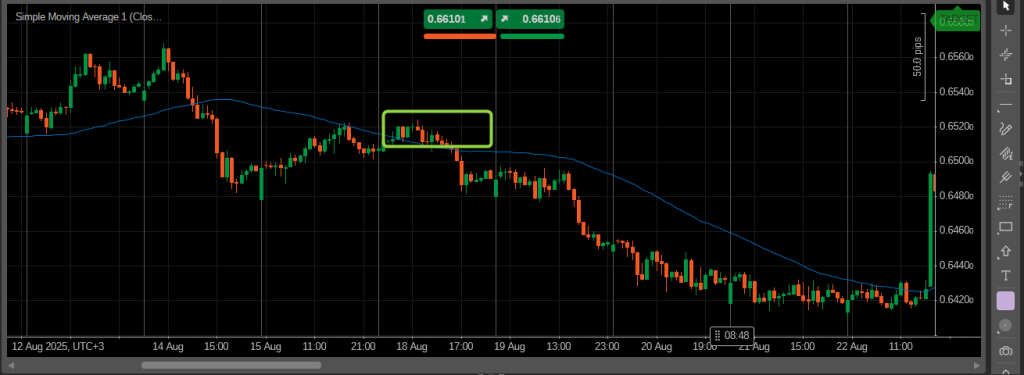
Another powerful tool is the SMA50, a widely used moving average that often acts as dynamic support or resistance. When price briefly pierces this level but quickly snaps back, it often signals that the breakout lacks conviction. Observing how price interacts with SMA50 can help traders avoid getting trapped by a false breakout, especially in volatile markets like forex or crypto, where momentum fakeout trading is common.
Finally, context matters. Checking higher timeframes and nearby support or resistance zones can clarify whether the breakout has a genuine chance to continue. By combining candlestick patterns, volume, moving averages, and broader market context, traders can significantly improve their ability to identify fakeouts before committing to a trade.
Trading Strategies for Fakeouts
Once a fakeout has been identified, the next step is deciding how to trade it effectively. One common approach is to wait for the breakout to fail completely and then trade in the opposite direction. For instance, if price briefly breaks above a resistance level but quickly falls back below it, this reversal often provides a high-probability entry point. Traders call this a reversal fakeout strategy, and it works well in markets with clear support and resistance zones.
Confirmation is crucial. Rather than entering immediately at the first sign of a reversal, many traders wait for a candle close back within the previous range, combined with increasing momentum in the opposite direction. This reduces the risk of being caught in a temporary retracement rather than a true fakeout. Low-frequency keywords like “fakeout candlestick patterns” and “breakout trap” describe these subtler signals that can guide entries and exits with more precision.
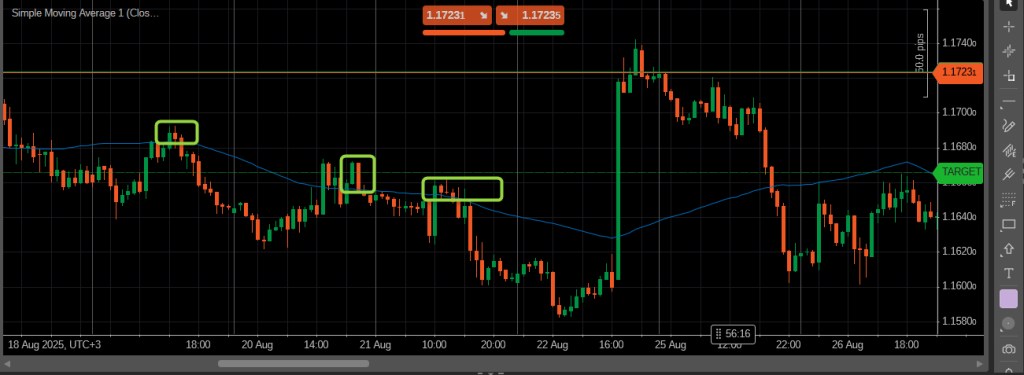
The SMA50 can also be integrated into these strategies. If the breakout initially crosses the SMA50 but price then closes back below it, this often reinforces the likelihood of a failed breakout. Traders who combine this moving average with price action can filter out weaker signals and focus on high-probability setups. Even without using multiple indicators, price behavior around SMA50 often provides enough insight to make informed decisions.
Stop-loss placement is another critical aspect of trading fakeouts. Placing stops beyond recent highs or lows, slightly outside the breakout zone, allows for natural price fluctuations while protecting against larger losses if the market moves against the trade. Similarly, profit targets can be set at the next significant support or resistance level, providing a clear risk-to-reward framework.
By carefully observing candlestick formations, volume, and moving averages like SMA50, traders can develop strategies that take advantage of false breakouts while minimizing risk. With practice, these techniques allow for more confident trading and reduce the frustration that often comes from being trapped in breakout failures.
Common Mistakes and How to Avoid Them
Even experienced traders can fall victim to fakeouts if they overlook certain details. One of the most frequent mistakes is entering a trade too early, right as price breaks a support or resistance level. Without confirmation, what looks like a strong breakout may quickly reverse, resulting in a losing trade. Patience is essential, and waiting for candlestick patterns, volume signals, or a close beyond key levels can dramatically reduce this risk.
Another common error is ignoring market context. Traders sometimes focus only on the immediate breakout, overlooking nearby support or resistance zones or higher timeframe trends. A breakout that seems strong on a one-hour chart may be insignificant on the daily chart. Observing broader price action and the overall trend helps to distinguish between genuine moves and false breakouts, improving the accuracy of entries and exits.
Overtrading during volatile periods or news releases is another pitfall. Fakeouts often occur around high-impact economic announcements, and entering trades without considering market volatility can be costly. Experienced traders may choose to step back during these times or trade with smaller positions, avoiding unnecessary exposure to sudden reversals.
Relying too heavily on indicators instead of price action is also a common mistake. While some traders use tools like RSI or Bollinger Bands to confirm breakout strength, the most reliable signals often come from observing candlestick formations and how price interacts with dynamic levels like SMA50. By focusing on these core signals, traders can simplify their approach and avoid the confusion caused by conflicting indicators.
Finally, improper stop-loss placement can turn a minor fakeout into a major loss. Setting stops too tight may result in being stopped out prematurely, while placing them too wide increases risk unnecessarily. Careful positioning based on recent highs, lows, and breakout zones allows for natural price fluctuations while keeping losses manageable.
By recognizing these common mistakes and adopting disciplined strategies, traders can navigate fakeouts more effectively and turn false breakouts into profitable opportunities.
Conclusion
Fakeouts are an inevitable part of trading, but understanding them can turn a frustrating experience into a profitable opportunity. By carefully observing candlestick patterns, monitoring volume, and using dynamic levels like the SMA50, traders can identify false breakouts before committing to a trade. Combining these tools with market context and higher timeframe analysis further increases the probability of success, helping to avoid the traps that catch novice traders.
Trading strategies focused on reversal fakeouts, breakout confirmation, and disciplined stop-loss placement allow traders to navigate both volatile forex markets and stocks with confidence. Awareness of common mistakes, such as entering too early, ignoring broader trends, or overtrading during news events, ensures that risk is managed effectively while opportunities are not missed.
Ultimately, mastering fakeouts requires patience, practice, and attention to subtle signals like breakout failure cues and momentum shifts. With experience, traders can leverage these insights to enhance their price action trading, minimize losses from false breakouts, and make more informed decisions in both intraday and longer-term trading scenarios. Understanding fakeouts isn’t just about avoiding traps—it’s about using them as a powerful signal in a disciplined trading approach.


