The Three Inside Up and Three Inside Down patterns are powerful reversal formations used by traders across forex, crypto, and stock markets. These candlestick patterns often signal a potential change in the prevailing trend, allowing traders to anticipate shifts in market momentum before they become obvious.
The Three Inside Up is a bullish reversal pattern that appears at the end of a downtrend, showing that sellers are losing control and buyers are beginning to dominate. The Three Inside Down, on the other hand, is a bearish reversal that forms at the top of an uptrend, indicating that bullish pressure is fading and sellers are stepping in.
Understanding how these patterns form, what they represent in terms of market psychology, and how to confirm them with other technical indicators can significantly improve your timing and accuracy in trading decisions. Whether you trade forex pairs, crypto assets, or equities, recognizing the Three Inside Up/Down patterns can help you capture strong reversals and build more reliable trading strategies.
Structure and Formation of the Three Inside Up/Down Pattern
The Three Inside Up and Down patterns consist of three candles that together reveal a shift in market sentiment. The first candle usually represents the dominant direction of the trend, the second one shows hesitation or a counter move, and the third confirms the reversal. Understanding the structure is essential to correctly identify these setups on a candlestick chart.
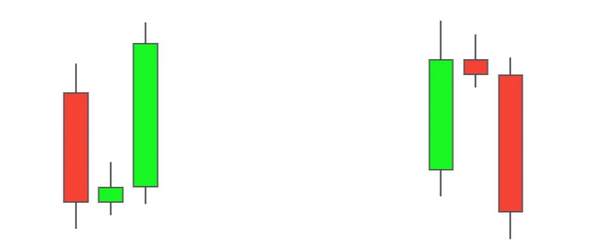
In the Three Inside Up pattern, the first candle is a large bearish candle that continues the existing downtrend. The second candle is a smaller bullish candle that forms inside the range of the first one, signaling that buyers are entering the market. The third candle is another bullish candle that closes above the high of the first candle, confirming that the reversal is in progress.
The Three Inside Down pattern works the opposite way. The first candle is a strong bullish one that continues the uptrend. The second candle is a smaller bearish candle, completely contained within the first candle’s body, showing that selling pressure is appearing. The third candle is another bearish candle closing below the low of the first candle, confirming that the bullish trend is over and a potential downtrend is starting.
These three candles together illustrate how momentum shifts from one side of the market to the other. The pattern reflects a gradual transition in trader sentiment, from dominance by one group to the emergence of the opposite side’s control. Recognizing this transition helps traders anticipate reversals early, especially when the pattern appears near key support or resistance levels.
Difference Between Three Inside Up and Three Inside Down
Although both patterns are built on the same principle of trend reversal, the key difference lies in their direction and the market psychology behind them. The Three Inside Up pattern signals a bullish reversal, while the Three Inside Down pattern indicates a bearish reversal. Understanding this distinction helps traders apply the right strategy according to the prevailing market conditions.
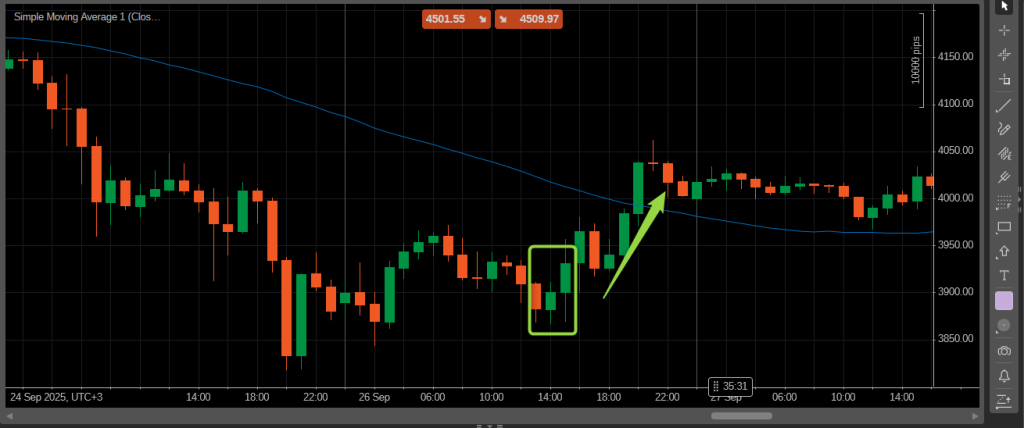
The Three Inside Up pattern forms after a downtrend. It shows that sellers are losing strength and buyers are gaining control. The second candle, which forms inside the first one, suggests indecision in the market, and the third bullish candle confirms that momentum has shifted upward. This structure gives traders confidence to look for long entries once the third candle closes above the first candle’s high.
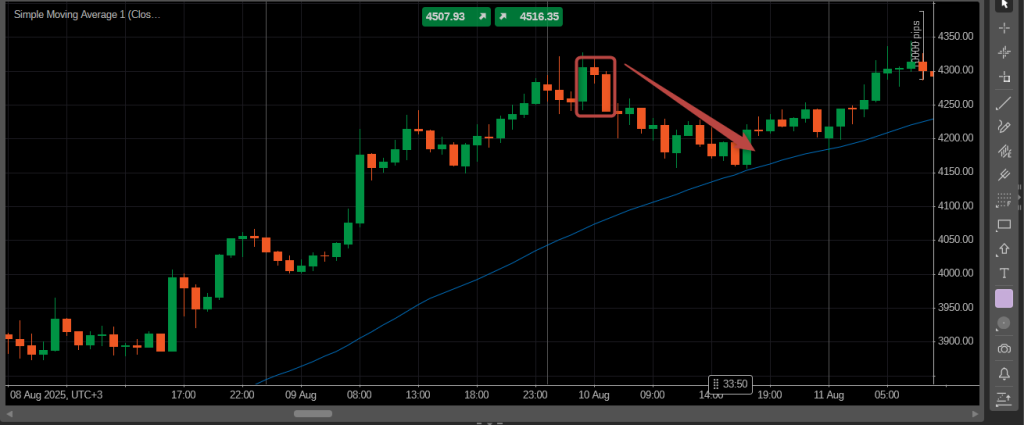
The Three Inside Down pattern appears after an uptrend. It demonstrates that buyers are losing dominance while sellers begin to take over. The smaller second candle inside the first one reflects hesitation, and the third bearish candle confirms that downward momentum has started. Traders often use this confirmation candle as a signal to enter short positions, especially when it aligns with resistance or other reversal indicators.
In essence, both patterns are mirror images of each other. The Three Inside Up represents a shift from bearish to bullish sentiment, while the Three Inside Down shows the opposite—from bullish to bearish. Recognizing which pattern is forming allows traders to react in time to a potential trend reversal and align their positions with the new market direction.
How to Identify the Pattern on a Chart
Spotting the Three Inside Up or Down pattern on a chart requires careful observation of candle formation and trend context. The first step is to confirm that the market is trending before the pattern appears. In a downtrend, look for a large bearish candle that represents strong selling pressure; in an uptrend, search for a strong bullish candle showing dominance from buyers.
For the Three Inside Up, the second candle must be smaller, bullish, and completely contained within the first candle’s body. This signals that selling pressure is weakening. The third candle should then close above the high of the first candle, confirming the reversal. The opposite applies for the Three Inside Down: the second candle is smaller and bearish inside the first bullish candle, and the third candle closes below the low of the first candle, confirming the bearish shift.
It is best to look for these patterns on higher timeframes such as the 4-hour, daily, or even weekly charts, since they provide stronger confirmation and reduce noise. On lower timeframes, false signals are more frequent due to market volatility and short-term fluctuations.
To increase reliability, traders often combine this visual pattern identification with technical tools such as moving averages, RSI, or support and resistance zones. For example, a Three Inside Up appearing near a major support level or above the SMA50 gives a stronger indication that a reversal is genuine. Similarly, a Three Inside Down forming near resistance or below key averages reinforces the bearish signal.
By learning to identify these setups accurately, traders can recognize shifts in sentiment early and enter trades with better timing, reducing the risk of false breakouts or premature entries.
Trading Strategy Using the Three Inside Up/Down Pattern
Once the pattern is identified, the next step is to apply a trading strategy that includes clear entry, stop-loss, and take-profit levels. The goal is not just to recognize the Three Inside Up or Down formation but to trade it with confirmation and proper risk control.
For the Three Inside Up, traders usually enter a long position after the third candle closes above the first candle’s high. This confirms that buyers have taken control. The stop-loss can be placed just below the low of the first candle, which represents the point where the setup would be invalidated. Take-profit targets are often set at the next resistance level or at a 1:2 or 1:3 risk-to-reward ratio, depending on market volatility.
For the Three Inside Down, the strategy is reversed. A short position is opened after the third candle closes below the low of the first candle. The stop-loss goes slightly above the high of the first candle, protecting the trade in case the market resumes its previous uptrend. Profit targets can be placed at the next support zone or calculated using Fibonacci extensions to project the potential move.
To make the strategy more reliable, traders often combine the pattern with confirmation tools. For instance, using the RSI indicator can help confirm overbought or oversold conditions. If the RSI shows a divergence during the Three Inside Up, it strengthens the bullish reversal signal. Likewise, a bearish divergence during the Three Inside Down pattern reinforces the sell setup.
Some traders also use the SMA50 or EMA20 to confirm the direction. When the pattern aligns with a moving average crossover or occurs near a major trendline, the signal becomes even stronger. Always wait for the third candle to close before entering the trade, as premature entries based on the first or second candle often lead to losses.
The Three Inside Up/Down strategy works best when combined with solid market context—trendlines, support and resistance, and volume analysis. These confirmations help filter weak setups and focus only on high-probability reversal points where momentum truly shifts.
Combining the Pattern with Other Indicators
While the Three Inside Up and Down patterns can provide reliable reversal signals on their own, using them together with technical indicators increases accuracy and reduces false entries. Indicators help confirm the strength of the shift in momentum and show whether the market environment supports the expected move.
One of the most popular tools to combine with this pattern is the Relative Strength Index (RSI). When a Three Inside Up appears while the RSI is rising from oversold territory, it strengthens the bullish reversal signal. Similarly, if a Three Inside Down forms while RSI is turning down from overbought levels, it confirms that sellers are taking control. This combination gives traders confidence to act only when momentum truly aligns with the pattern.
The Moving Average Convergence Divergence (MACD) is another useful indicator for confirmation. If the MACD histogram crosses above the signal line near a Three Inside Up, it supports the buying signal. Conversely, if it crosses below during a Three Inside Down formation, it validates the bearish sentiment. Traders often wait for these crossovers to occur close to the pattern for stronger reliability.
Fibonacci retracement levels can also help identify potential entry and exit zones. For example, if the Three Inside Up forms near the 61.8% retracement level of a previous upward move, the pattern indicates that the correction may be over and the bullish trend could resume. The same logic applies for the Three Inside Down forming near the 61.8% retracement of a downward correction.
Support and resistance zones remain essential elements of confirmation. A Three Inside Up forming at a strong support level suggests that buyers are defending this zone. Meanwhile, a Three Inside Down appearing at resistance signals that sellers are ready to push prices lower.
By combining the pattern with RSI, MACD, Fibonacci levels, and price zones, traders can build a confluence-based strategy that filters out low-quality setups. The more factors that align in the same direction, the higher the probability of a successful trade, allowing for better risk management and consistent performance across different markets.
Common Mistakes When Trading the Three Inside Up/Down
Even though the Three Inside Up and Down patterns are highly effective reversal signals, many traders make predictable mistakes that weaken their results. Understanding these errors and avoiding them can make the difference between a successful trade and a false signal.
Here are the most common mistakes traders make:
- Entering before the third candle closes. The second candle inside the first one only shows hesitation, not confirmation. Entering too early can lead to false entries, especially in volatile markets. Always wait for the third candle to close above or below the first candle before taking a position.
- Ignoring the overall market trend. The pattern is most effective when it appears after a clear directional move. In sideways or ranging markets, it often gives unreliable signals. Confirm the broader trend on higher timeframes before trading.
- Skipping confirmation tools. Many traders rely solely on the pattern’s appearance without using supporting indicators like RSI, MACD, or moving averages. Combining the Three Inside Up/Down with these tools provides stronger validation and filters out weak setups.
- Poor stop-loss placement. Placing stops too tight or not using them at all is a common mistake. The stop-loss should be positioned just beyond the first candle’s extreme to allow normal price movement and protect against sudden reversals.
- Ignoring key levels. Failing to consider support and resistance can lead to losing trades. A Three Inside Up forming below resistance or a Three Inside Down forming above support is less reliable. Always trade in harmony with important price zones.
- Trading without context. The pattern must fit into a larger technical picture. If market structure, momentum, or volume doesn’t support the signal, it’s best to wait for more evidence.
- Emotional and impulsive trading. Jumping into trades just because the candles look similar to the pattern often leads to losses. Patience and discipline are key. Wait for full confirmation before entering.
Avoiding these mistakes helps you use the Three Inside Up and Down patterns with confidence and precision. By combining patience, confirmation, and solid risk management, traders can turn this classic candlestick setup into a consistent part of their strategy.
Conclusion
The Three Inside Up and Three Inside Down patterns are powerful tools for identifying potential trend reversals in forex, crypto, and stock markets. By carefully observing the three-candle formation, traders can anticipate shifts in market momentum before they become obvious, giving them an edge in timing entries and exits.
Success with these patterns depends on proper confirmation and risk management. Waiting for the third candle to close, checking the broader trend, and using supporting indicators like RSI, MACD, moving averages, and key support or resistance levels significantly increases the probability of a successful trade.
While the patterns can appear on any timeframe, higher timeframes such as 4-hour, daily, or weekly charts typically provide stronger and more reliable signals. Combining the Three Inside Up/Down setups with solid technical analysis and disciplined trading practices allows traders to filter false signals and focus on high-probability reversal points.
By practicing these strategies on demo accounts and carefully analyzing chart examples, traders can incorporate the Three Inside Up and Down patterns into a consistent trading plan. With patience, confirmation, and proper risk control, these candlestick patterns can become a reliable part of any trader’s toolkit for identifying profitable trend reversals.


