If you’re looking to boost your trading game, combining the SMA50 (50-period Simple Moving Average) with candlestick reversal patterns could be a game-changer. This powerful strategy helps you spot potential market reversals and take advantage of trend shifts, exactly what you need for consistent profits.
In this guide, we’ll walk you through the simple steps to set up and use the SMA50 Reversal Strategy on FXPro’s cTrader platform. We’ll focus on how to identify candlestick reversal patterns and use them alongside the SMA50 to confirm your trade setups.
Whether you’re new to the strategy or just looking to refine your skills, this guide will help you trade with more confidence and precision.
Step 1. Set Up Your cTrader Platform
Before you can start applying the SMA50 Reversal Strategy, you need to make sure your FXPro cTrader platform is ready for action. Here’s how you can get started:
- Register for an Account: If you don’t already have one, visit the FXPro website and sign up for a new account. The registration process is quick and requires some basic information, including your name, email, and phone number. You’ll also need to verify your identity to comply with regulatory requirements. The verification process usually involves uploading a proof of identity (e.g., passport or driver’s license) and proof of address (e.g., utility bill or bank statement).
- Deposit Funds: Once your account is verified, you’ll need to deposit funds into your trading account. FXPro supports various deposit methods, including bank transfers, credit/debit cards, and e-wallets. You can start with as little as $10, but a deposit of $200–$500 is recommended for more flexibility in your trading and risk management. Larger deposits, like $1,000 or more, can give you more room to maneuver, but always ensure the amount aligns with your risk tolerance.
- Open a New Demo Account at FXPro: After you register and deposit funds, get into your dashboard and create a new demo account there. I prefer the cTrader platform, so you can start using it in your browser right away.
Step 2. Add the SMA50 Indicator
The SMA50 is a crucial part of the SMA50 Reversal Strategy, helping you identify the medium-term market trend. It’s one of the most widely used indicators for determining support and resistance levels, which is essential for spotting reversals. Here’s how you can add the SMA50 indicator on the cTrader platform:
- Open Your Chart: After logging into your FXPro cTrader account, select the currency pair you want to trade (e.g., EUR/USD).
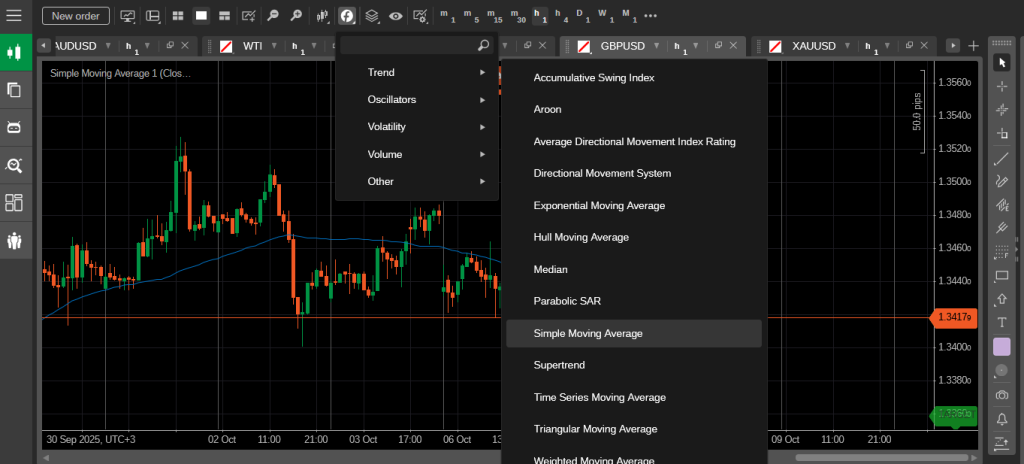
- Access the Indicators: On the cTrader platform, click on the “Indicators” tab at the top of the screen.
- Search for SMA: In the search box, type SMA to bring up the Simple Moving Average option.
- Apply the SMA50: Select Simple Moving Average (SMA), then set the period to 50. This will apply the 50-period moving average to your chart.
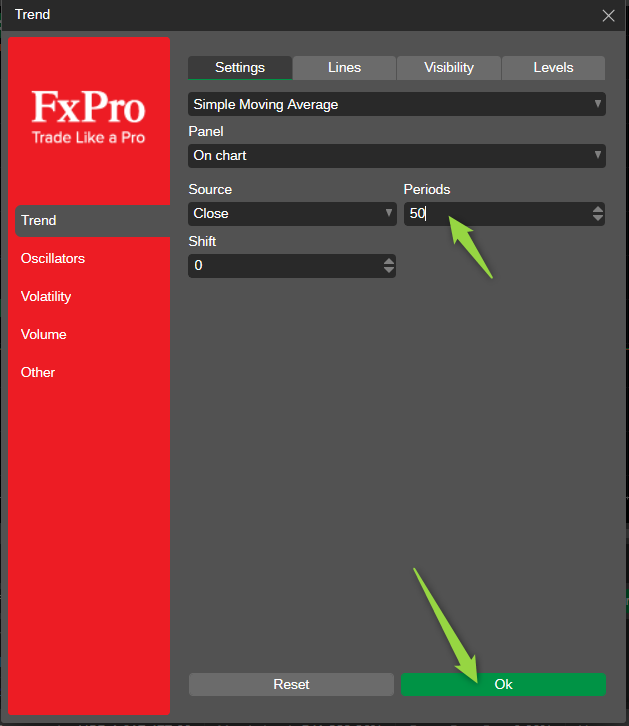
Once applied, the SMA50 will be displayed on your chart as a line that tracks the average price of the asset over the last 50 periods. This line will act as a key support or resistance level, helping you spot potential reversals when combined with candlestick patterns.
Step 3. Identify Candlestick Reversal Patterns
Once the SMA50 indicator is applied to your chart, it’s time to start looking for candlestick reversal patterns. These patterns will help you identify potential market reversals at the key levels of support or resistance marked by the SMA50. Here’s how to spot them:
Look for Bullish Reversal Patterns Below the SMA50:
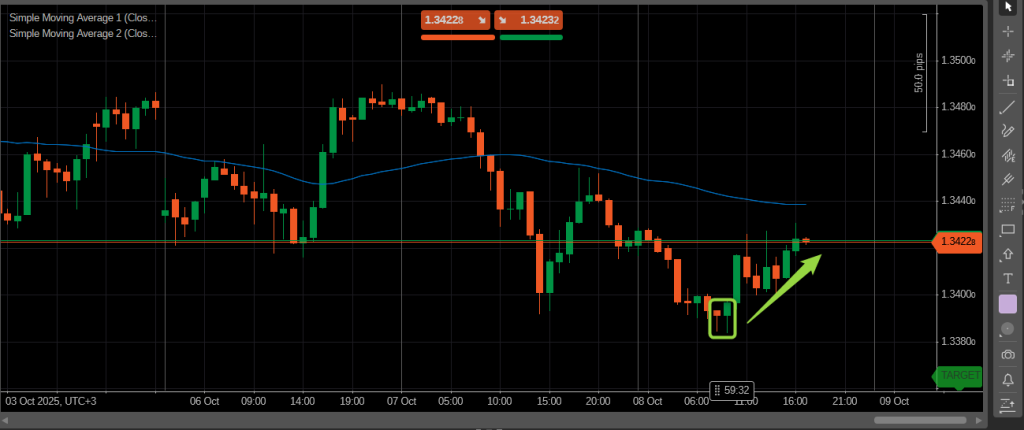
When the price is trading below the SMA50, watch for bullish patterns like the Bullish Engulfing or Hammer. These patterns signal that the market may be reversing to the upside. A bullish reversal signal at the SMA50 occurs when the price fails to break below the support level created by the SMA50 and instead starts moving higher.
Look for Bearish Reversal Patterns Above the SMA50:
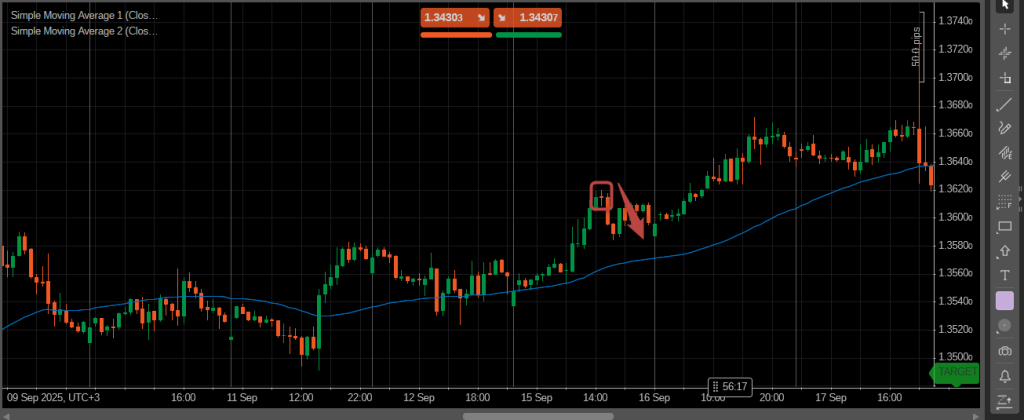
When the price is trading above the SMA50, look for bearish patterns like the Bearish Engulfing or Shooting Star. These patterns signal that the market could be reversing to the downside. A bearish reversal signal at the SMA50 happens when the price fails to break above the resistance level created by the SMA50 and starts moving lower.
Look for Reversal Signals When the SMA50 is Tested as Support:
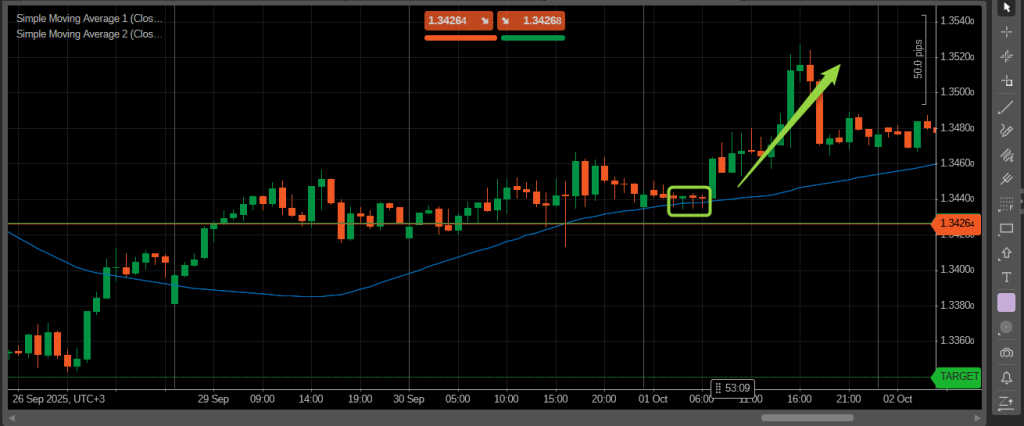
When the price tests the SMA50 from below, this indicates the market may be trying to find support. If the price fails to break below the SMA50 and shows a bullish reversal pattern (such as a Bullish Engulfing or Hammer), this is a strong sign that the market could be reversing to the upside.
Look for Reversal Signals When the SMA50 is Tested from Above:
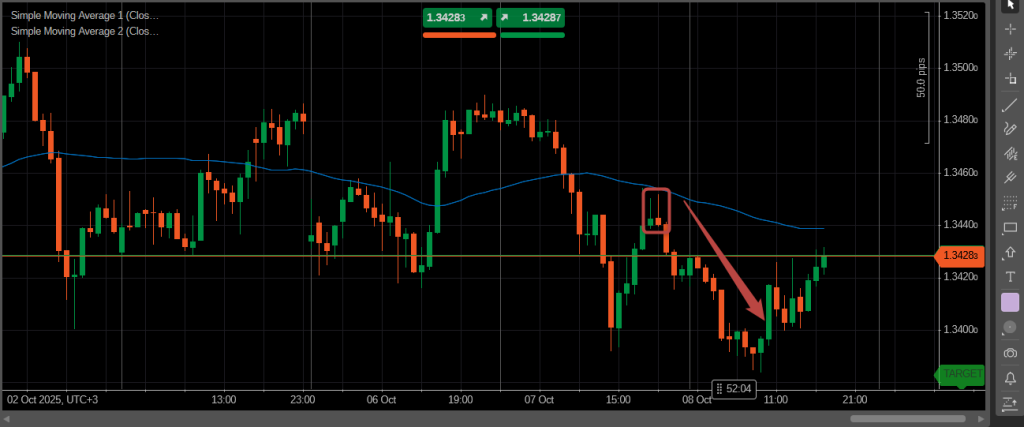
When the price tests the SMA50 from above, it indicates the market may be facing resistance. If the price fails to break above the SMA50 and forms a bearish reversal pattern (like a Bearish Engulfing or Shooting Star), it could signal that the market is about to reverse downward.
These candlestick patterns are critical to confirming a potential reversal at the SMA50 level. Keep in mind that the market may not reverse immediately after a pattern forms, so confirmation through price action (such as a break of the SMA50) is necessary to validate the reversal.
Step 4. Place Your Trade
Now that you’ve confirmed the reversal, it’s time to enter your trade. The proper entry point is essential to maximizing your potential profit and minimizing your risk. Here’s how you can place your trade on cTrader:
- Enter a Buy Trade for Bullish Reversals:
If a bullish reversal pattern has formed below the SMA50 and the price has broken above the SMA50 with confirmation, it’s time to enter a buy trade. Open a long position by clicking on the “Buy” button on your cTrader platform. The trade is confirmed when the price is moving in the direction of the reversal. - Enter a Sell Trade for Bearish Reversals:
If a bearish reversal pattern has formed above the SMA50 and the price has broken below the SMA50 with confirmation, you should enter a sell trade. Open a short position by clicking on the “Sell” button on your cTrader platform. This trade is confirmed when the price is moving downward after the reversal. - Set Your Position Size:
Before you enter a trade, determine your position size based on your risk tolerance. For example, if you’re willing to risk 2% of your account balance on each trade, calculate your position size accordingly.
By placing your trade at the confirmed reversal point, you give yourself the best chance to profit from the move while limiting your exposure to unnecessary risk.
Step 5. Set Stop Loss and Take Profit
After entering your trade, it’s essential to protect your position and manage risk by setting a stop loss and take profit. These levels help you limit your losses and lock in profits when the market moves in your favor. Here’s how you can set them on cTrader:
- Set Stop Loss:
Place your stop loss just below or above the most recent swing point (for a buy trade) or above or below the most recent swing point (for a sell trade). For a buy trade, set the stop loss just below the recent low, and for a sell trade, set the stop loss just above the recent high. This ensures that your stop loss is placed at a reasonable level, keeping it outside of normal market fluctuations while limiting potential losses. - Set Take Profit:
Set your take profit based on a favorable risk-to-reward ratio, typically 1:2 or 1:3. This means for every $1 you risk, you aim to make $2 or $3 in profit. You can set your take profit at a logical level, such as a previous support or resistance zone or the next price target based on market structure. - Risk/Reward Ratio:
A good risk/reward ratio ensures that the potential reward justifies the risk taken on each trade. Aim for a ratio of at least 1:2, meaning you should be aiming for double the amount of profit compared to the amount of risk you’re willing to take.
Setting stop loss and take profit orders automatically allows you to remove emotions from trading and ensures you stick to your trading plan, even if you’re not actively monitoring the market.
Step 6. Exit the Trade
The final step in the SMA50 Reversal Strategy is knowing when to exit the trade. Whether your trade hits the take profit or the market moves against you, exiting the trade at the right time is crucial to securing profits or minimizing losses. Here’s how to exit the trade effectively:
- Exit When Take Profit is Hit:
If the price reaches your take profit level, exit the trade. This is the optimal scenario, where the market has moved in your favor and reached your profit target. Ensure that your trade reaches your set take profit point and close it at that level for a successful trade. - Exit If Price Reverses Through the SMA50:
If the price moves against your position and breaks through the SMA50 in the opposite direction, consider exiting the trade. A break of the SMA50 signals a potential reversal, and you don’t want to stay in the trade when the market is no longer moving in your favor. - Exit Early if Market Conditions Change:
If you notice significant changes in market conditions, such as major news releases or price action that contradicts your analysis, consider exiting early. Being flexible and ready to cut your losses when necessary is an important part of risk management.
Exiting the trade at the right time can make the difference between a profitable trade and a losing one. Always stick to your trading plan, and don’t let emotions dictate your decision to stay in or exit a trade.
Tips for Success
While the SMA50 Reversal Strategy is effective, there are additional tips and techniques you can use to improve your trading results. Here are some best practices to help you succeed:
- Use Multiple Timeframe Analysis:
Confirm your trade setup by looking at multiple timeframes. If you see a reversal pattern on the 1-hour chart, check the 4-hour or daily chart to see if the trend aligns across different timeframes. A reversal signal that appears across multiple timeframes carries more weight and is more likely to be reliable. - Combine SMA50 with Other Indicators:
Combining the SMA50 with other technical indicators, like the RSI or MACD, can provide additional confirmation. For example, if you spot a bullish reversal pattern at the SMA50 and the RSI shows that the market is oversold, this strengthens the probability of a successful trade. The MACD can also help identify momentum shifts in the market. - Manage Risk:
Always adhere to a strict risk management strategy. Don’t risk more than a small percentage (e.g., 1-2%) of your account balance on any single trade. Managing your risk properly helps you stay in the game longer and protects your capital. - Avoid Overtrading:
Stick to the strategy and only trade when the setup is clear. Overtrading can lead to emotional decision-making and increase the likelihood of losses. Be patient and wait for the right setup rather than trying to force trades. - Keep Practicing:
The more you practice using the SMA50 Reversal Strategy, the more refined your decision-making will become. Consider using a demo account to practice without risking real money. Over time, you’ll become more comfortable with spotting reversal patterns and reacting to price action.
By following these tips, you can further enhance your chances of success with the SMA50 Reversal Strategy and become a more disciplined and effective trader.


