The MACD indicator, or Moving Average Convergence Divergence, is one of the most widely used tools in technical analysis. It helps traders spot changes in momentum, identify trends, and find potential entry and exit points in various markets including stocks, forex, and crypto.
What makes the MACD popular is its simplicity and versatility. It’s useful for both beginners learning how to read indicators and advanced traders developing complex strategies. When used correctly, the MACD can provide valuable buy and sell signals that support better decision-making.
In this article, we’ll break down everything you need to know about the MACD indicator, from how it works and how to set it up, to the best settings for different trading styles like scalping or intraday. We’ll also explore how accurate the MACD really is, how to combine it with other indicators, and what alternatives are available if you’re looking to expand your strategy.
Whether you’re trading Bitcoin, traditional stocks, or other assets, understanding the MACD can give you an edge in the market.
What Is the MACD Indicator?
The MACD indicator, short for Moving Average Convergence Divergence, is a trend-following momentum indicator. It shows the relationship between two moving averages of a security’s price — usually the 12-period and 26-period exponential moving averages (EMAs). The MACD is designed to help traders identify shifts in momentum and potential reversals in market trends.
The MACD consists of three main components:
- MACD Line – The difference between the 12-period EMA and the 26-period EMA.
- Signal Line – A 9-period EMA of the MACD Line, used to trigger buy and sell signals.
- Histogram – A visual representation of the difference between the MACD Line and the Signal Line. It expands and contracts based on momentum.
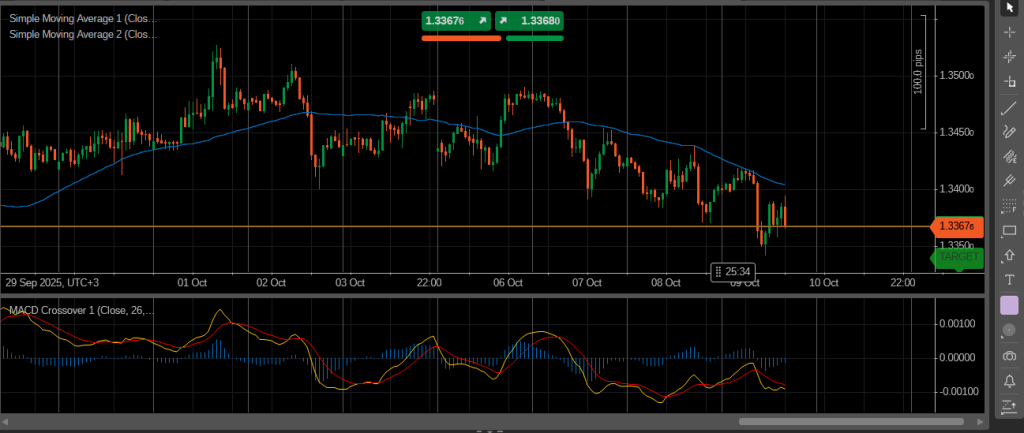
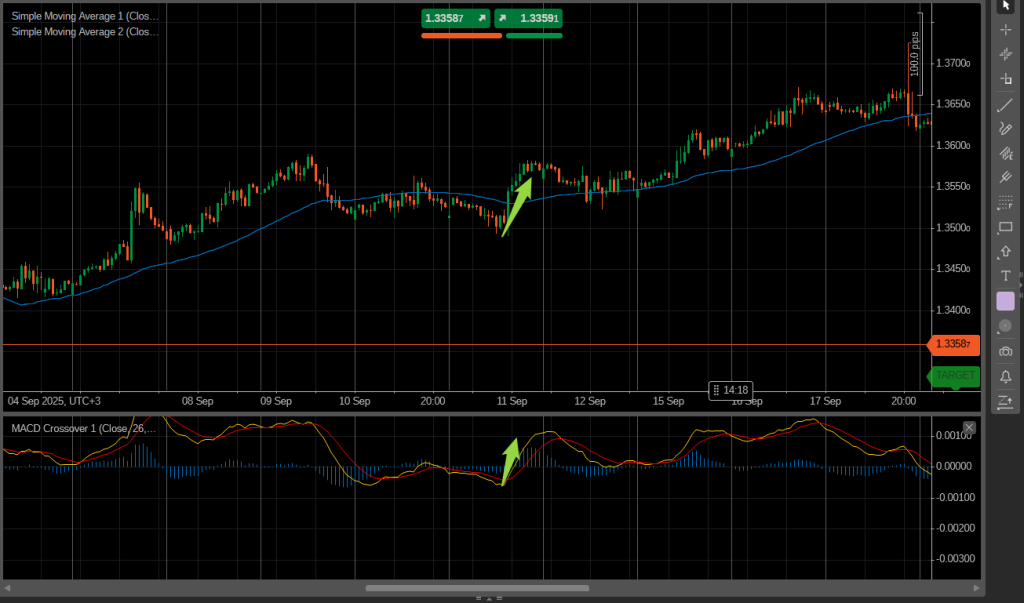
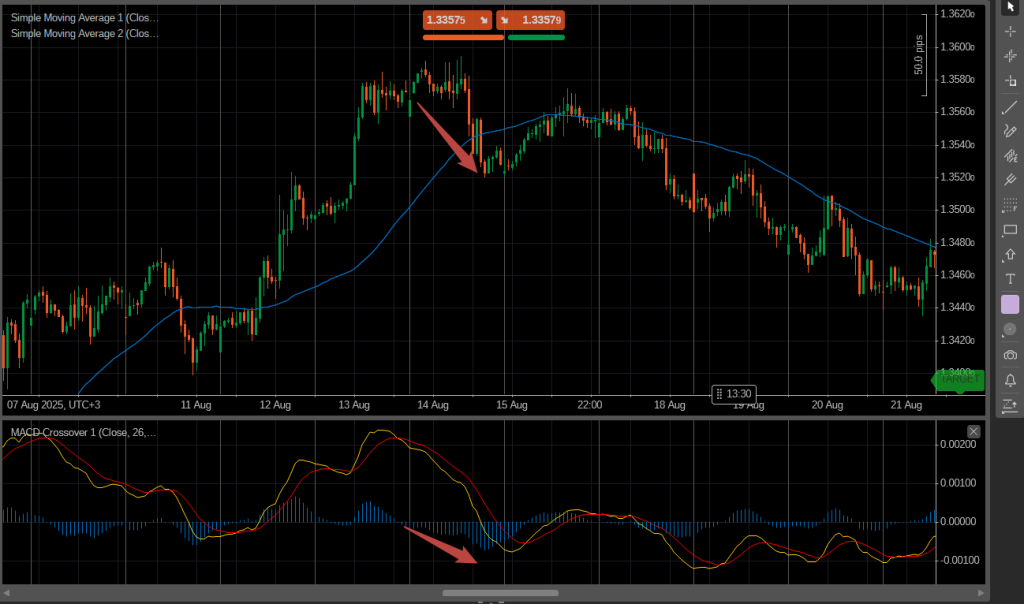
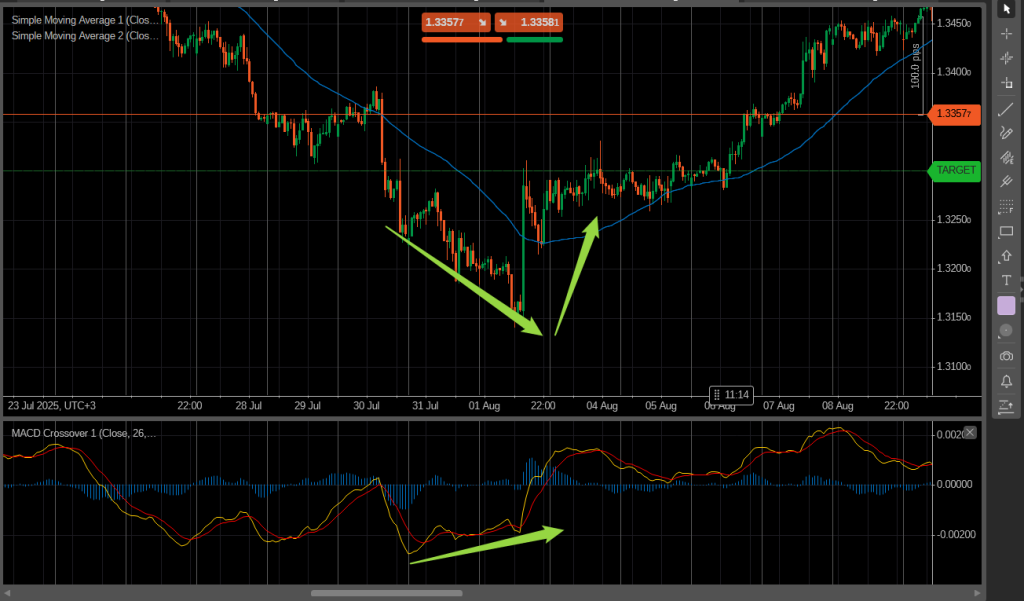
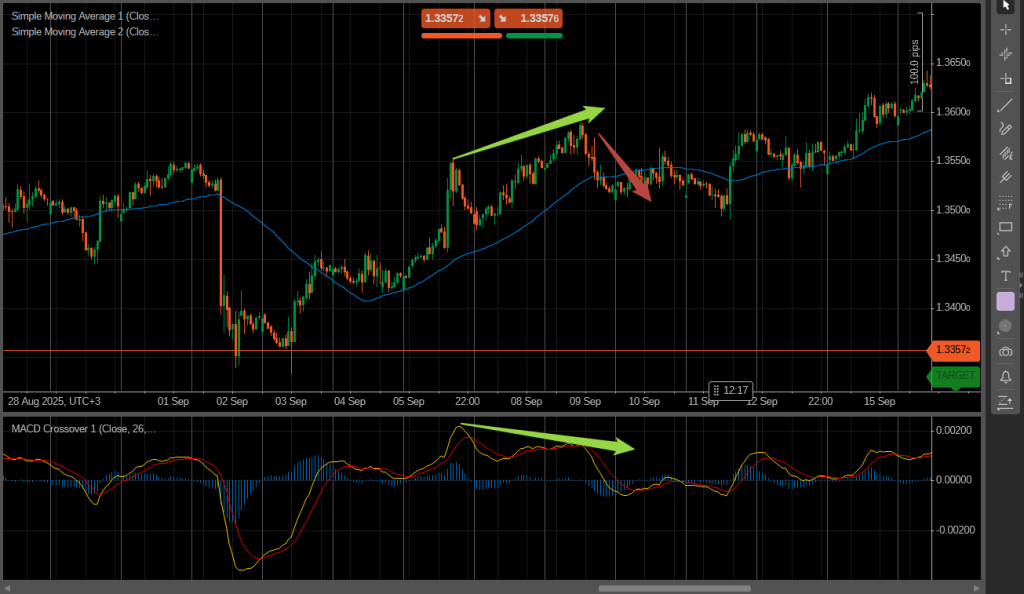
When the MACD Line crosses above the Signal Line, it may indicate a bullish signal (buy). When it crosses below, it may suggest a bearish signal (sell). The histogram helps traders visualize the strength and direction of that momentum.
The MACD indicator is valuable because it combines both trend and momentum into one tool. It reacts to price movement while smoothing out short-term volatility, making it useful across multiple timeframes and asset classes.
Start trading with the Best and regulated Brokerage, Join FXPro, try in the demo and then trade for real money
How the MACD Indicator Works
To understand how the MACD indicator works, it’s important to know that it is based on exponential moving averages (EMAs), which give more weight to recent prices. The indicator is calculated by subtracting the 26-period EMA from the 12-period EMA. This creates the MACD Line, which fluctuates above and below a centerline (zero).
Here’s a step-by-step breakdown of how it works:
- MACD Line = 12-EMA – 26-EMA
This line reflects short-term momentum compared to longer-term momentum. When the MACD Line is above zero, it means the 12-period EMA is greater than the 26-period EMA — a potential sign of upward momentum. - Signal Line = 9-period EMA of the MACD Line
This line smooths out the MACD and is used as a trigger. Crossovers between the MACD Line and Signal Line generate trading signals. - Histogram = MACD Line – Signal Line
The histogram helps visualize the distance between the MACD Line and the Signal Line. When the histogram grows, it signals increasing momentum. When it shrinks, momentum is fading.
Key MACD Concepts:
- MACD Crossover:
When the MACD Line crosses above the Signal Line, it can indicate a potential buy signal.
When the MACD Line crosses below the Signal Line, it can suggest a sell signal. - MACD Divergence:
This occurs when the price of an asset moves in the opposite direction of the MACD.- Bullish divergence: Price makes a lower low, but the MACD makes a higher low — potential reversal upward.
- Bearish divergence: Price makes a higher high, but the MACD makes a lower high — potential reversal downward.
- Zero Line Crossover:
When the MACD Line crosses above the zero line, it confirms bullish momentum.
When it crosses below the zero line, it confirms bearish momentum.
The MACD is not a predictive tool, but a reactive one. It responds to price movement rather than forecasting it. For that reason, it’s best used in combination with other indicators like RSI, trendlines, or support and resistance levels.
Start trading with the Best and regulated Brokerage, Join FXPro, try in the demo and then trade for real money
How to Read the MACD Indicator
Reading the MACD indicator is straightforward once you understand its components and how they behave during market movements. It helps traders identify shifts in momentum, trend direction, and potential entry or exit points.
Here’s how to interpret the MACD:
1. MACD Line vs. Signal Line Crossovers
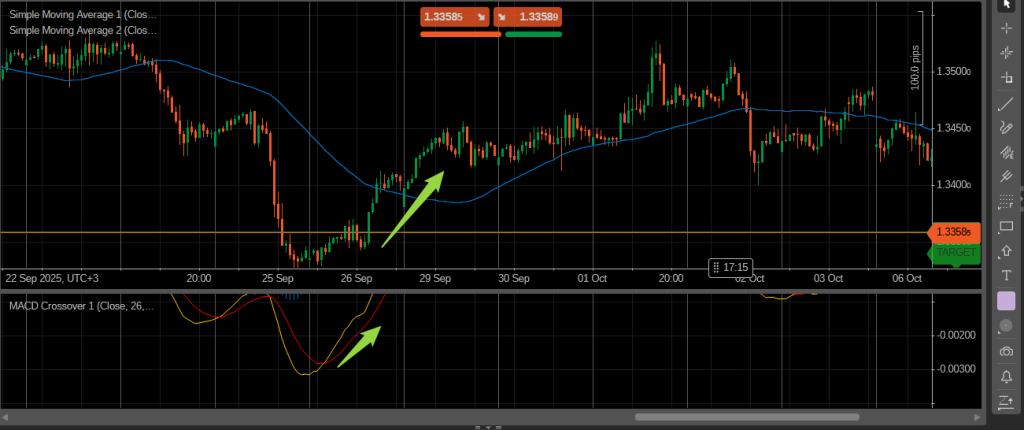
- Bullish crossover: When the MACD Line crosses above the Signal Line, it may signal a buy opportunity, especially if it happens below the zero line and is followed by rising momentum.
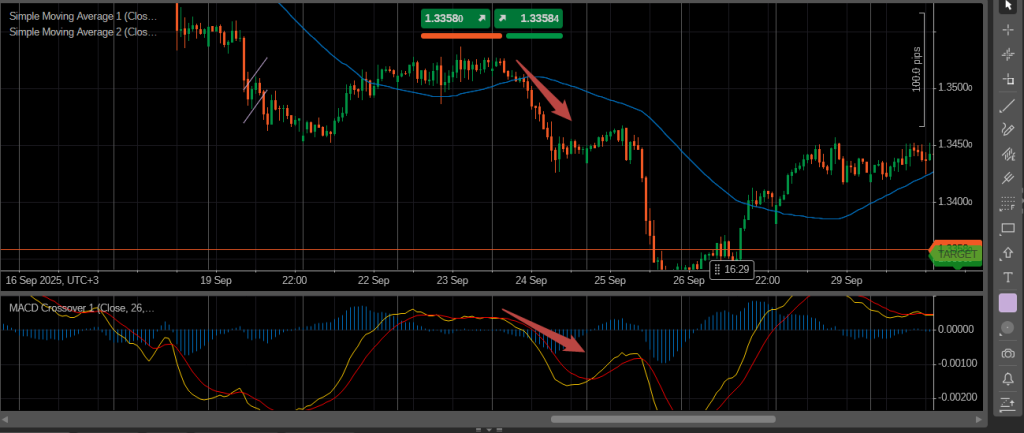
- Bearish crossover: When the MACD Line crosses below the Signal Line, it may indicate a sell signal, especially if it happens above the zero line and momentum starts fading.
These crossovers are among the most common ways to generate buy and sell signals with the MACD indicator.
2. Histogram Interpretation
The MACD histogram shows the distance between the MACD Line and the Signal Line:
- A growing histogram (in either direction) means momentum is strengthening.
- A shrinking histogram means momentum is weakening.
This helps traders anticipate a potential crossover before it occurs.
3. Zero Line Crossovers
- When the MACD Line moves above the zero line, it means the short-term momentum is stronger than the long-term, suggesting an uptrend.
- When it moves below the zero line, it indicates possible downtrend conditions.
These zero line crossovers are useful for confirming the strength of a trend.
4. Divergence Between MACD and Price
- Bullish divergence: Price makes a lower low while the MACD makes a higher low. This often signals that downward momentum is weakening and a reversal may be near.
- Bearish divergence: Price makes a higher high while the MACD makes a lower high, warning that the uptrend may be losing steam.
Divergence is considered a leading signal, but should be confirmed with price action or other tools before acting on it.
Example:
Let’s say you’re trading Bitcoin. You notice the MACD Line is crossing above the Signal Line while both are below the zero line. At the same time, the histogram starts growing upward. This may signal a bullish reversal is forming, especially if price begins to form higher lows.
Start trading with the Best and regulated Brokerage, Join FXPro, try in the demo and then trade for real money
How to Set the MACD Indicator
Setting up the MACD indicator is simple, but choosing the right settings for your trading style can make a big difference in how effective it is. Most trading platforms like TradingView, MetaTrader, and cTrader include MACD by default, and you can adjust the settings based on your strategy.
Default MACD Settings:
- Fast EMA (Short-term): 12
- Slow EMA (Long-term): 26
- Signal Line EMA: 9
These default values (12, 26, 9) are widely used and work well in many situations — especially for swing trading and general market analysis. They were originally created for daily charts in the stock market, but they’re also commonly used in crypto and forex.
How to Set MACD in Most Platforms:
- Open your chart and search for MACD in the indicator list.
- Click to add it to your chart.
- You’ll typically see the MACD Line, Signal Line, and Histogram automatically appear.
- To change the settings, go into the MACD’s options and adjust the 12, 26, or 9 values to suit your strategy.
When and Why to Adjust MACD Settings:
- For Scalping (short timeframes):
Use faster EMAs like 6, 13, 5 to make the MACD more responsive to small price changes. - For Intraday Trading:
Try slightly faster settings like 8, 21, 5 or stick with 12, 26, 9 on a lower time frame (5m, 15m, 1h). - For Swing or Position Trading:
Use the default 12, 26, 9 or slower settings like 19, 39, 9 to reduce noise on higher timeframes (daily, weekly).
There’s no one-size-fits-all. It depends on your trading style, asset volatility, and timeframe. It’s often a good idea to backtest your MACD settings on historical data to see how they would have performed.
Pro Tip: When adjusting settings, avoid making the MACD too sensitive, or it may give too many false signals.
Best MACD Settings by Trading Style
The MACD indicator can be adjusted to fit different trading styles and timeframes. While the default settings (12, 26, 9) work well for many situations, fine-tuning the inputs can help generate more precise signals based on your strategy.
For scalping, faster settings like 6, 13, 5 are often used. These make the MACD more responsive to quick price movements, which is essential for short-term trades. Scalpers usually apply this setup on 1-minute to 5-minute charts.
Intraday traders tend to use slightly modified settings like 8, 21, 5 or stick with the default 12, 26, 9. These are applied on 15-minute to 1-hour charts and provide a good balance between sensitivity and reliability. This setup helps catch trend changes without overreacting to short-term volatility.
Swing traders or position traders generally use the default MACD settings or slower ones like 19, 39, 9. These are best suited for daily or weekly charts. The slower settings filter out market noise and focus on capturing larger, longer-term price movements.
For crypto trading or volatile assets like Bitcoin, slightly faster settings such as 10, 21, 9 or 8, 21, 5 are often used. These help react more quickly to the fast-paced nature of the crypto market, especially when combined with momentum indicators or breakout patterns.
There’s no universal best MACD setting, it depends on your goals, asset class, and timeframe. The key is to experiment with settings, backtest them, and combine MACD signals with other tools like RSI, volume, or trendlines for added confirmation.
MACD Buy and Sell Signals
The MACD indicator is widely used to generate buy and sell signals by analyzing the interaction between the MACD Line, the Signal Line, and the Histogram. These signals help traders decide when to enter or exit a trade based on momentum and trend shifts.
The most common MACD signals are:
1. Signal Line Crossovers
This is the most popular and straightforward use of the MACD.
- Buy signal: When the MACD Line crosses above the Signal Line, it indicates increasing bullish momentum. This is typically seen as a signal to buy or go long.
- Sell signal: When the MACD Line crosses below the Signal Line, it suggests bearish momentum is building. This is seen as a signal to sell or go short.
These crossovers are more reliable when they occur below the zero line for buys or above the zero line for sells, as they suggest a stronger potential shift in trend.
2. Zero Line Crossovers
This method focuses on the MACD Line crossing the center (zero) line.
- When the MACD Line moves from below to above zero, it confirms a potential uptrend.
- When it moves from above to below zero, it may signal a downtrend is forming.
Traders often use this as a trend confirmation rather than an early entry.
3. Histogram Reversals
The MACD Histogram shows the difference between the MACD Line and the Signal Line.
- When the histogram shifts from negative to positive, it can hint at growing bullish momentum.
- When it shifts from positive to negative, it may indicate rising bearish pressure.
Many traders use histogram changes to anticipate upcoming crossovers or trend shifts.
4. Divergence-Based Signals
MACD divergence occurs when the price and the MACD move in opposite directions.
- Bullish divergence: Price makes a lower low while the MACD makes a higher low. This can indicate weakening selling pressure and a possible reversal upward.
- Bearish divergence: Price makes a higher high while the MACD makes a lower high. This may suggest the current uptrend is losing strength and a reversal downward could follow.
While divergence can be a powerful early warning, it works best when confirmed by actual crossovers or candlestick patterns.
5. MACD + Other Indicators
To reduce false signals, many traders combine MACD with other indicators like:
- RSI (Relative Strength Index) for overbought/oversold confirmation
- Moving averages for trend direction
- Support and resistance levels for entries or exits
Combining tools helps validate signals and improves decision-making, especially in volatile markets.
Start trading with the Best and regulated Brokerage, Join FXPro, try in the demo and then trade for real money
MACD Indicator in Crypto and Forex Markets
The MACD indicator is extremely popular in both crypto and forex markets due to its ability to capture momentum changes and trend reversals in volatile environments. However, because these markets can be highly unpredictable and fast-moving, traders often adjust their approach to using the MACD accordingly.
In crypto trading, such as Bitcoin, the MACD is used to identify trend strength and potential reversals in a market known for rapid price swings. Traders often prefer faster MACD settings like 8, 21, 5 to capture quicker signals, helping them respond to sudden price moves. The MACD’s divergence signals are particularly valuable in crypto for spotting possible reversals early.
In the forex market, the MACD is widely applied on multiple timeframes, from 5-minute charts for day trading to daily charts for swing trading. Forex traders often stick to default MACD settings (12, 26, 9) but may customize them based on the currency pair’s volatility. The MACD helps traders confirm trend direction and momentum, which is crucial when trading forex pairs influenced by macroeconomic news and events.
One important note for both markets is that no indicator is perfect. The MACD can produce false signals, especially during ranging or sideways markets. Therefore, it’s advisable to combine MACD signals with other tools such as volume indicators, trendlines, or oscillators like RSI to increase accuracy.
Overall, the MACD indicator remains a powerful tool for traders across crypto and forex markets when used with proper settings and risk management.
MACD Indicator Accuracy and Limitations
While the MACD indicator is a powerful tool for spotting momentum changes and trend reversals, it is important to understand its limitations and accuracy in real trading.
Accuracy of the MACD indicator depends on the market conditions and the settings used. It tends to work best in trending markets where momentum shifts are clear. During strong uptrends or downtrends, MACD crossovers and divergences can provide reliable buy and sell signals.
However, in sideways or choppy markets, the MACD can produce false signals or “whipsaws.” This happens because the moving averages may cross frequently without a sustained trend, leading to multiple losing trades if used alone.
The MACD is also a lagging indicator, which means it reacts to past price movements rather than predicting future ones. This lag can result in delayed signals, causing traders to enter or exit trades late.
To improve MACD accuracy, many traders:
- Combine MACD with other technical indicators such as RSI, volume, or support and resistance.
- Use MACD divergence in conjunction with price action confirmation.
- Adjust MACD settings to fit the timeframe and volatility of the asset.
- Apply risk management techniques such as stop-loss orders to protect against false signals.
In summary, while the MACD indicator is effective and widely used, relying on it exclusively is not recommended. Understanding its strengths and weaknesses helps traders use it more effectively and avoid common pitfalls.
Alternatives to the MACD Indicator
While the MACD indicator is popular and effective, some traders look for alternatives that might better suit their trading style or offer different insights. Here are a few commonly used alternatives to the MACD:
- Relative Strength Index (RSI):
RSI measures the speed and change of price movements, indicating overbought or oversold conditions. It’s a momentum oscillator that complements or substitutes the MACD for timing entries and exits. - Stochastic Oscillator:
This indicator compares a particular closing price to a range of prices over time. Like the RSI, it’s useful for spotting overbought and oversold conditions and can signal potential reversals. - Awesome Oscillator (AO):
Similar to the MACD histogram, the AO measures market momentum by comparing moving averages. It provides visual cues for trend shifts and is often used in combination with other indicators. - Moving Average Ribbon:
This involves multiple moving averages of different lengths layered together, offering a dynamic view of trend strength and direction without relying solely on MACD crossovers. - Volume-Weighted Average Price (VWAP):
VWAP combines price and volume data to show the average price a security has traded at throughout the day, useful for intraday traders.
Each alternative has its own strengths and may perform better in specific market conditions. Many traders combine MACD with one or more of these to build a robust trading system.
Start trading with the Best and regulated Brokerage, Join FXPro, try in the demo and then trade for real money
Advanced MACD Strategies
For experienced traders looking to get more out of the MACD indicator, there are several advanced strategies that go beyond simple crossovers. These techniques can help improve signal accuracy and timing in different market conditions.
One popular advanced strategy is the Double MACD, where two MACD indicators with different settings are used simultaneously. For example, one MACD with faster settings captures short-term momentum, while a slower MACD focuses on the overall trend. Signals generated when both MACDs align can be stronger confirmations.
Another approach is combining MACD with price action analysis. This involves looking for MACD signals that coincide with key support or resistance levels, chart patterns (like triangles or head and shoulders), or candlestick formations. This synergy can reduce false signals and improve trade entries.
MACD divergence is also considered an advanced technique. Traders watch for bullish or bearish divergences as early warning signs of reversals, but they wait for additional confirmation like a crossover or price breakout before acting.
Some traders enhance the MACD with volume indicators to validate momentum changes. For instance, a MACD crossover with increasing volume may confirm a strong move, while a crossover on low volume might be suspect.
Finally, customizing MACD settings for specific assets and timeframes allows traders to adapt to unique market behaviors. This requires backtesting and ongoing adjustment but can yield more precise signals.
These advanced strategies require practice and experience, but when used correctly, they can significantly boost the effectiveness of the MACD indicator.
Start trading with the Best and regulated Brokerage, Join FXPro, try in the demo and then trade for real money
Conclusion and Summary
The MACD indicator remains one of the most versatile and widely used tools in technical analysis. It helps traders identify momentum shifts, trend changes, and potential buy and sell signals through the interaction of its three components: the MACD Line, Signal Line, and Histogram.
Understanding how the MACD works, how to read its signals, and how to customize its settings according to your trading style is key to using it effectively. While the default settings (12, 26, 9) are a solid foundation, adjusting the MACD for scalping, intraday, swing trading, or volatile markets like crypto can improve its responsiveness and accuracy.
Keep in mind that the MACD is a lagging indicator and can produce false signals, especially in sideways markets. To overcome this, combine the MACD with other indicators such as RSI, volume, and support/resistance levels. Advanced strategies like Double MACD or divergence analysis can further enhance your trading edge.
Whether you’re trading stocks, forex, or cryptocurrencies, mastering the MACD indicator will give you valuable insights into market momentum and trend strength, helping you make more informed trading decisions.
MACD Indicator Cheat Sheet
What is MACD?
A momentum and trend-following indicator that shows the relationship between two EMAs (Exponential Moving Averages).
Components:
- MACD Line = 12 EMA – 26 EMA
- Signal Line = 9 EMA of MACD Line
- Histogram = MACD Line – Signal Line
Default Settings:
- Fast EMA: 12
- Slow EMA: 26
- Signal EMA: 9
How to Read MACD Signals
- Buy Signal: MACD Line crosses above Signal Line
- Sell Signal: MACD Line crosses below Signal Line
- Zero Line Crossover:
- MACD Line moves above zero = bullish trend
- MACD Line moves below zero = bearish trend
- Histogram:
- Growing histogram = strengthening momentum
- Shrinking histogram = weakening momentum
- Divergence:
- Price makes lower lows + MACD makes higher lows = bullish divergence (potential reversal)
- Price makes higher highs + MACD makes lower highs = bearish divergence (potential reversal)
Best MACD Settings by Trading Style
| Trading Style | Settings | Timeframe |
|---|---|---|
| Scalping | 6, 13, 5 | 1m, 3m, 5m |
| Intraday Trading | 8, 21, 5 or 12, 26, 9 | 15m, 30m, 1h |
| Swing/Position Trading | 12, 26, 9 or 19, 39, 9 | 4h, Daily, Weekly |
| Crypto Trading | 8, 21, 5 or 10, 21, 9 | 1h to Daily |
Tips for Using MACD Effectively
- Combine with other indicators like RSI, volume, or support/resistance levels for confirmation
- Avoid relying solely on MACD in sideways or choppy markets
- Backtest different settings to suit your asset and timeframe
- Use advanced strategies like Double MACD or divergence for more reliable signals
- Always apply risk management with stop-loss orders
Start trading with the Best and regulated Brokerage, Join FXPro, try in the demo and then trade for real money


