The moving average in trading is a technique used to smooth out price data over a specific period, helping traders identify trends and potential reversal points. One of the most common questions beginners ask is: is the simple moving average the same as moving average? While “moving average” is a general term, the simple moving average is a specific type that calculates the average closing prices over a defined number of periods.
In this article, we’ll break down the moving average meaning in trading, explain how it works, and explore practical ways to use the simple moving average in trading. Whether you’re trading stocks, forex, or crypto, mastering this indicator can offer a clearer perspective in ever-changing markets.
How Does Simple Moving Average Work?
The simple moving average is a calculation that helps traders smooth out price fluctuations and better understand the overall direction of a market. But how does simple moving average work in practice?
To calculate a simple moving average, you take the sum of a set number of closing prices and divide that total by the number of periods. For example, a 20-day simple moving average adds up the last 20 closing prices and divides the result by 20. This average moves forward each day, dropping the oldest price and adding the newest, which is why it’s called a “moving” average.
The formula for a simple moving average is:
Simple Moving Average = (Sum of closing prices over a specific number of periods) ÷ (Number of periods)
For example, if you’re calculating a 5-day simple moving average and the last five closing prices are 20, 22, 21, 23, and 24, the sum is 110. Divide that by 5, and the simple moving average is 22.
The simple moving average doesn’t react sharply to short-term price spikes or drops, which makes it useful for identifying broader trends and support or resistance levels. By smoothing the data, it gives traders a better picture of whether the market is generally trending up, down, or sideways.
Understanding what is a simple moving average in trading and how it operates is crucial because it forms the foundation of many technical strategies. With simple moving averages explained clearly, traders can begin to apply them with more confidence in live market scenarios.
How to Use Simple Moving Average in Trading
Once you understand how it works, the next step is learning how to use simple moving average in trading. This tool can help identify the direction of a trend, spot potential entry or exit points, and confirm signals from other technical indicators.
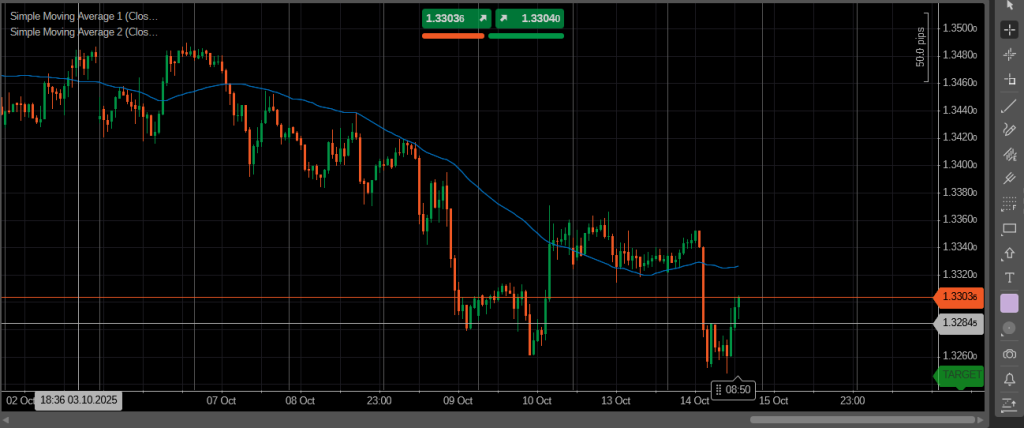
One of the most common ways traders use the simple moving average is by observing how the price behaves around it. When the price stays above the moving average, it often indicates an uptrend. When the price is below it, the market could be in a downtrend. Traders may choose to buy when the price crosses above the moving average and sell when it crosses below.
Using moving average to trade isn’t limited to identifying trend direction. It can also act as dynamic support or resistance. For instance, during an uptrend, a stock may pull back and bounce off the simple moving average before continuing higher. In a downtrend, the average may serve as a ceiling, where price gets rejected before moving lower again.
Understanding how to use moving average in stock market conditions requires observing how it behaves during different phases—trending, ranging, or volatile periods. Some traders combine multiple moving averages (like the 20-hours and 50-hours) to create crossover strategies, while others use it alongside volume indicators or momentum oscillators.
In short, the simple moving average is a flexible tool. Whether used alone or with other indicators, it can offer valuable insights into market behavior and trading opportunities.
Simple Moving Average for Different Trading Styles
The simple moving average isn’t a one-size-fits-all tool. Its effectiveness depends largely on how it’s used within different trading styles. Traders often adjust the period of the SMA based on whether they are day trading, swing trading, or trading intraday. Choosing the right setup can significantly impact the accuracy of signals and timing.
For example, the simple moving average for day trading is usually set to shorter periods like 5, 10, or 50. This helps capture quick price movements and trends within the same trading day. The best simple moving average for day trading often depends on the asset’s volatility and the trader’s preferred timeframe. A common choice is the 50-period SMA, which balances responsiveness with trend smoothing.
When it comes to simple moving average for intraday trading, traders may even look at one-minute or five-minute charts using fast SMAs to capture micro-trends. These shorter averages help pinpoint exact entry or exit moments in fast-moving markets.
In contrast, the simple moving average for swing trading might use longer periods like 50 or 100 to focus on multi-day or multi-week trends. Swing traders aim to catch the “middle” of a trend, and a longer SMA helps filter out short-term noise.
The key is to align your SMA period with your trading strategy and time horizon. Day traders prioritize speed and sensitivity, while swing traders need a broader view of the trend. The flexibility of the SMA makes it valuable across all styles.
Popular Simple Moving Average Periods
Choosing the right simple moving average periods is essential for effective trading. Different periods serve different purposes, and traders often rely on common simple moving averages that have proven useful over time.
Some of the most widely used simple moving average periods include 20, 50, 100, and 200. The 20 simple moving average is popular for short-term trend analysis and is often used by day traders and swing traders alike. The 50 and 100-period SMAs are more suited for intermediate-term trends, while the 200-period SMA is widely recognized as a major indicator of long-term market direction.
What simple moving average to use ultimately depends on your trading style and goals. Shorter periods respond more quickly to price changes but may produce more false signals, while longer periods smooth out volatility but react slower.
Common simple moving averages act as benchmarks in many trading strategies, helping traders identify key support and resistance levels as well as trend reversals. By understanding the strengths and weaknesses of each period, you can tailor your approach to fit your market and timeframe.
Simple Moving Average Trading Strategies
Simple moving average trading strategy is a popular approach used by many traders because of its simplicity and effectiveness. By applying SMAs to price charts, traders can identify trends, generate buy and sell signals, and manage risk.
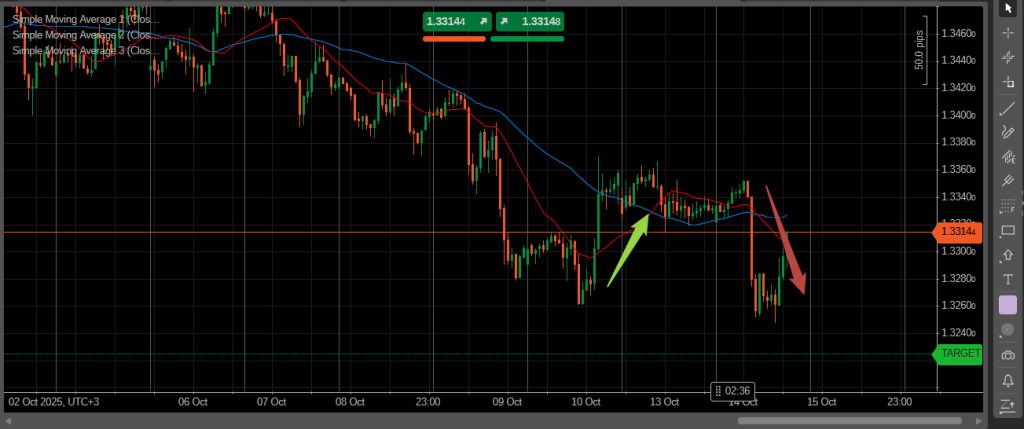
One common example is the simple moving average forex trading strategy, which often involves using two SMAs of different periods—such as the 20-hour and 50-hour—to spot trend changes. When the shorter SMA crosses above the longer SMA, it generates a bullish signal, indicating a potential buy opportunity. Conversely, when the shorter SMA crosses below the longer one, it signals a possible sell.
Trading simple moving average techniques are not limited to crossovers. Some traders use SMAs to confirm trends by watching how price interacts with the average, whether it holds as support in an uptrend or resistance in a downtrend. These strategies can be adapted for various markets, including stocks, forex, and commodities.
Overall, simple moving average trading offers a straightforward way to harness market momentum and make informed decisions. Its flexibility allows traders to combine it with other indicators or trading tools to build more robust systems.
Simple Moving Average Buy/Sell Signals
One of the key reasons traders rely on the simple moving average is its ability to generate clear buy and sell signals. The simple moving average buy sell signal often comes from observing how the price interacts with the SMA or through moving average crossover strategies.
A common method is the trading simple moving average crossover, where two SMAs with different periods are used. For example, when a short-term SMA crosses above a long-term SMA, it produces a buy signal, suggesting the start of an upward trend. Conversely, when the short-term SMA crosses below the long-term SMA, it indicates a sell signal, pointing to a potential downward move.
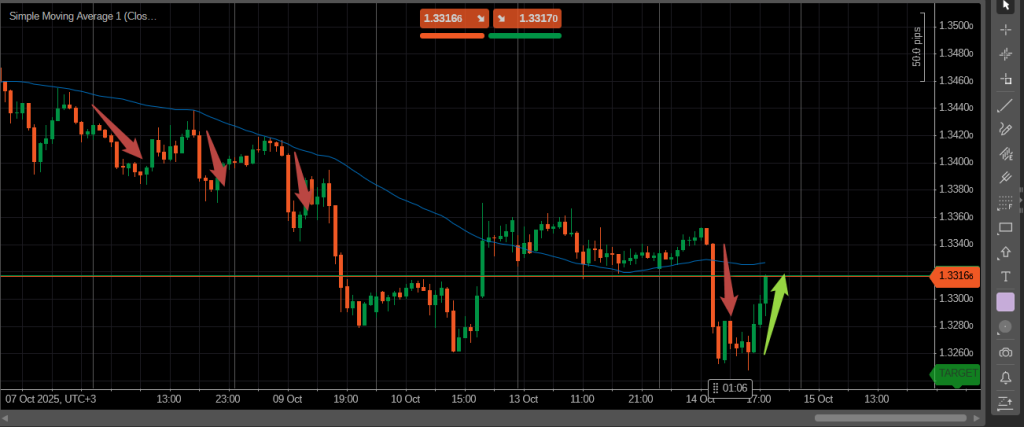
These crossover signals help traders time their entries and exits more effectively. In addition to crossovers, price crossing above or below a single SMA can also act as a signal — price moving above the SMA might suggest bullish momentum, while dropping below it could warn of bearish pressure.
Using simple moving average buy sell signals effectively requires understanding the market context and combining them with other tools to avoid false signals, especially in sideways or choppy markets.
Simple Moving Average vs Exponential Moving Average
When choosing between simple moving average or exponential moving average, traders often wonder which is better suited for their strategy. Both are types of moving averages used to smooth price data, but they differ in how they weight recent prices.
The simple moving average vs ema debate centers on responsiveness. The simple moving average gives equal weight to all prices in the selected period, which means it reacts more slowly to recent price changes. In contrast, the exponential moving average (EMA) places more weight on the most recent prices, making it more sensitive and quicker to reflect price movements.
Understanding these differences helps traders decide when to use each. Simple moving averages are often preferred for identifying longer-term trends due to their smoothness and reduced sensitivity to short-term fluctuations. EMAs, on the other hand, are popular for short-term trading because they react faster to new information.
Here is a quick comparison table:
| Feature | Simple Moving Average (SMA) | Exponential Moving Average (EMA) |
|---|---|---|
| Weighting | Equal weight to all periods | More weight to recent prices |
| Responsiveness | Slower to react to price changes | Faster to react to price changes |
| Best for | Longer-term trends | Short-term trends and quicker signals |
| Sensitivity | Less sensitive to price spikes | More sensitive to price spikes |
| Use case | Smooths out volatility | Captures recent momentum |
Ultimately, knowing the strengths and limitations of both indicators can improve how you incorporate moving averages into your trading approach.
Conclusion
The simple moving average remains one of the most fundamental and versatile tools in technical analysis. From understanding what is simple moving average in trading to learning how to use it effectively across different trading styles, the SMA offers valuable insight into market trends and potential entry or exit points.
Whether you are day trading with short-term SMAs like the 20 simple moving average, swing trading with longer periods, or using crossover strategies to generate buy and sell signals, mastering the simple moving average can improve your trading decisions.
By comparing simple moving average vs ema, you can choose the best moving average type for your strategy, while platforms like TradingView make it easy to apply and customize SMAs in real time.
Incorporating simple moving averages into your trading toolkit allows you to analyze price trends more clearly and react with greater confidence in various market conditions.
Frequently Asked Questions (FAQ)
What is a simple moving average in trading?
A simple moving average (SMA) is a technical indicator that calculates the average closing price of an asset over a specific number of periods, helping traders identify trends by smoothing out price fluctuations.
How do you use a simple moving average in trading?
Traders use SMAs to determine the direction of a trend, identify support and resistance levels, and generate buy or sell signals, often by watching price interactions with the SMA or by using crossover strategies involving two SMAs.
What are common simple moving average periods?
Common SMA periods include 20, 50, 100, and 200. Shorter periods like 20 are popular for short-term trading, while longer periods like 100 or 200 are used for analyzing long-term trends.
What is the best simple moving average for day trading?
Many day traders prefer the 20 simple moving average because it balances responsiveness and smoothness, but the best period can vary depending on the asset and trading style.
How does the simple moving average differ from the exponential moving average?
The SMA gives equal weight to all periods, reacting more slowly to recent price changes, whereas the EMA gives more weight to recent prices, making it more sensitive and quicker to respond to price movements.
Are simple moving averages useful for forex trading?
Yes, simple moving averages are widely used in forex trading strategies, including crossover systems, to help identify trends and generate trading signals.


