Markets are mixed on Tuesday as investors digest Canadian inflation data, UK borrowing figures, and Japan’s trade balance. Thin liquidity persists while central bank commentary dominates headlines. Canadian CPI data is in sharp focus today, with the potential to influence CAD flows ahead of the Bank of Canada’s next decision. Cautious risk appetite and the absence of U.S. data due to the ongoing government shutdown continue to limit strong directional moves.
Key Data Releases to Watch Today
- CAD CPI m/m: Previous: –0.1% | Forecast: –0.1%
- CAD Median CPI y/y: Previous: 3.1% | Forecast: 3.0%
- CAD Trimmed CPI y/y: Previous: 3.0% | Forecast: 3.0%
- CAD Common CPI y/y: Previous: 2.5% | Forecast: 2.6%
- CAD Core CPI m/m: Previous: 0.1% | Forecast: 0.0%
- CHF Trade Balance: Previous: 3.37B | Forecast: 4.01B
- GBP Public Sector Net Borrowing: Previous: 17.7B | Forecast: 20.7B
- JPY Trade Balance: Previous: –0.93T | Forecast: –0.15T
IMPORTANT NOTE: U.S. data remains limited due to the ongoing government shutdown.

Central Bank Speakers Today
- European Central Bank: Christine Lagarde, Joachim Nagel
- Federal Reserve: Patrick Harker, Christopher Waller
- Global: Ongoing IMF Meetings
EUR/USD
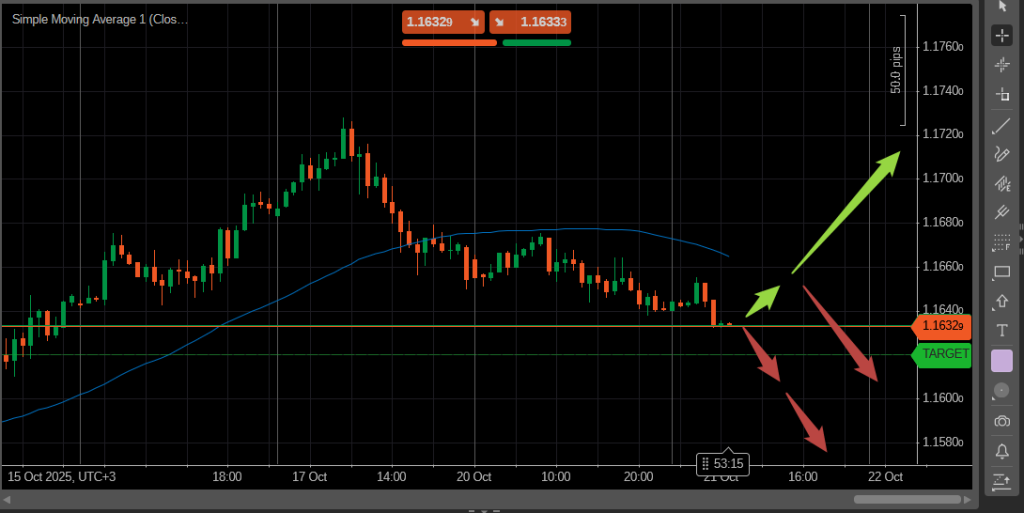
EUR/USD is trading near 1.1633 and has broken below short-term support at 1.1640. The pair remains under pressure, with price consistently trending below the SMA50 on the hourly chart. A sustained move below 1.1620 could confirm a downside breakout, targeting further support near 1.1600 and 1.1580. If bulls manage to reclaim 1.1640, a corrective move toward the SMA50 is possible. Watch for candlestick signals or volume confirmation near support for any reversal attempts.
Closest support levels: 1.1620, 1.1600, 1.1580
Closest resistance levels: 1.1640, 1.1680, 1.1710

Gold
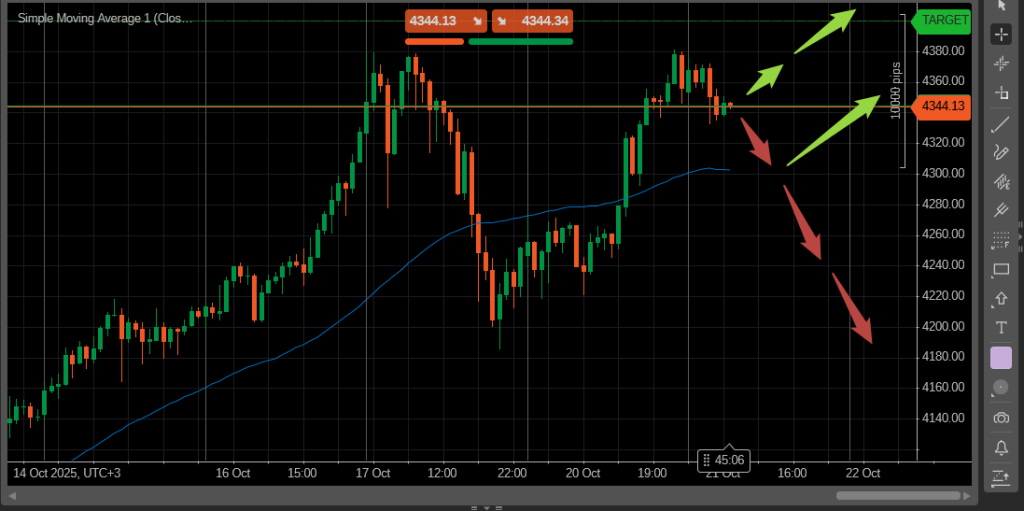
Gold is trading around 4,344 and remains supported by bullish momentum. The price is consolidating above the SMA50 on the hourly chart after a strong upside move earlier in the week. The current setup shows a potential continuation higher if the price holds above the 4,320–4,330 support area. However, if that zone breaks, the market may retrace deeper toward the SMA or lower support levels.
Buyers remain in control as long as price stays above the moving average, but signs of slowing momentum suggest traders should watch for confirmation before entering fresh longs. A break above 4,360 could open the way toward new highs.
Closest support levels: 4,330, 4,300, 4,280
Closest resistance levels: 4,360, 4,380, 4,400
WTI Crude Oil

WTI crude is trading sideways, consolidating after a prolonged downtrend while testing resistance near the SMA50. The market shows signs of indecision as traders weigh supply and demand expectations. A breakout above the moving average could signal short-term recovery, while rejection from this zone may resume the bearish trend.
Closest support levels: 56.60, 56.00, 55.20
Closest resistance levels: 57.10, 57.80, 58.60

Bitcoin
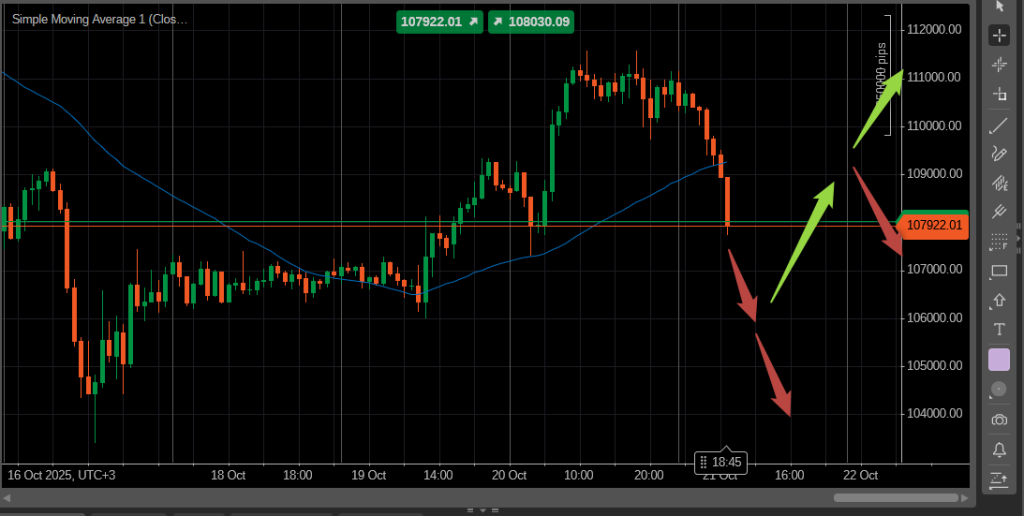
Bitcoin is under pressure, retreating after failing to hold above recent highs. The price has broken below the SMA50, signaling weakening short-term momentum. Market participants are watching the current support zone for a potential rebound; otherwise, a sustained drop below this level could open the way for deeper correction.
Closest support levels: 107600, 106000, 104200
Closest resistance levels: 108800, 110000, 111800
Ethereum
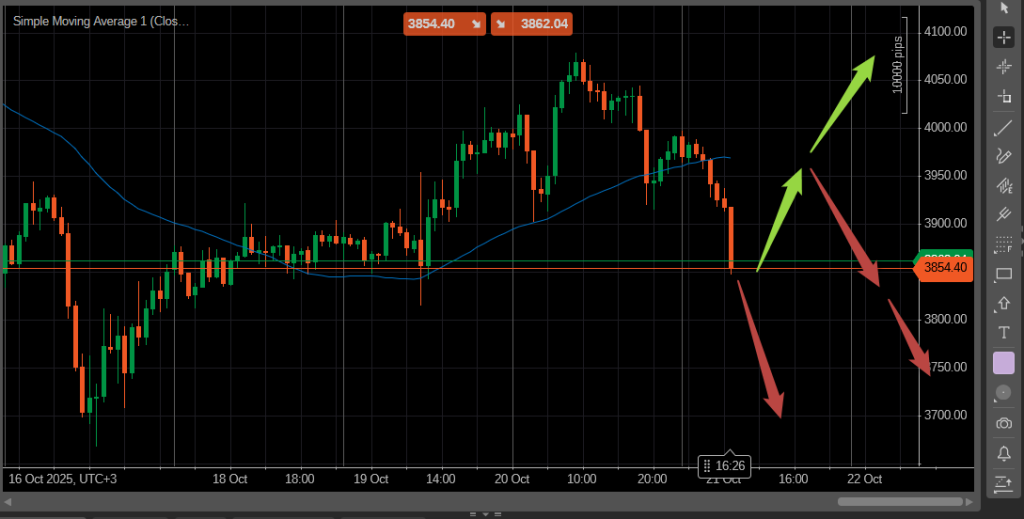
Ethereum is declining, pressured by recent profit-taking after failing to extend gains above 4000. The price has broken below the SMA50, testing key support around 3850. A rebound from this zone could revive bullish momentum, while a clear breakdown may trigger deeper losses toward lower support levels.
Closest support levels: 3820, 3750, 3670
Closest resistance levels: 3920, 4000, 4070