When I first started trading, I remember staring at a candlestick chart and feeling completely lost. All those colorful bars, wicks, and shapes seemed like a foreign language I couldn’t understand. But once I took the time to learn the Japanese candlestick basics, everything started to click. It was like someone finally explained the candlestick chart in a way that made sense, not just lines and colors, but a clear story of how price moved during each time period.
Understanding these charts became a game-changer for me. A single candle is more than just a bar; it tells you the open and close price, the highs and lows, and the battle between buyers and sellers. Once I grasped the candlestick chart explained fundamentals, I felt confident analyzing the market’s mood and predicting potential moves.
In this tutorial, I want to share the exact steps I followed to learn Japanese candlestick basics, break down the anatomy of a candle, and show you how to read these charts with confidence. Whether you’re brand new to trading or have tried to understand candlesticks before but got overwhelmed, this guide will simplify the concepts and get you comfortable with reading and using candlestick charts in your own trading journey.
Understanding the Basics of Japanese Candlesticks
When I first encountered a candlestick chart, I had no idea what I was looking at. But once I learned the candlestick charting basics, everything started to fall into place. So, what are Japanese candlesticks exactly?
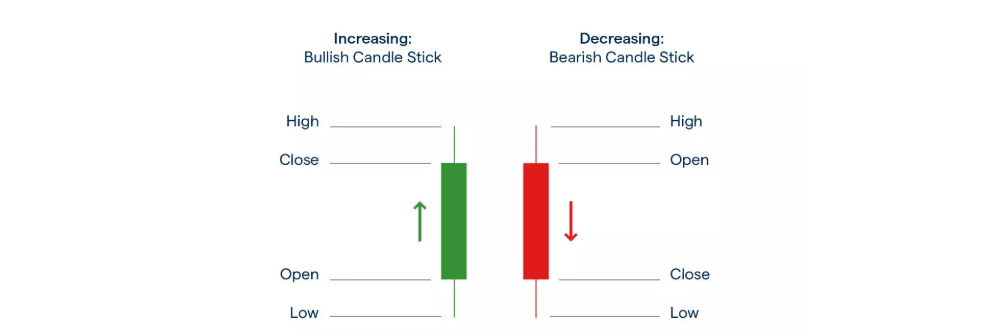
Japanese candlesticks are a type of price chart used in trading that visually represent the price movement within a specific time frame. Each candlestick shows four key pieces of information: the open, high, low, and close prices. The body of the candle represents the range between the opening and closing prices, while the thin lines above and below, called wicks or shadows, show the highest and lowest prices reached during that period.
What really helped me was realizing that these candles aren’t just random shapes, they tell a story about the battle between buyers and sellers. A green (or white) candle means the price closed higher than it opened, signaling bullish momentum. A red (or black) candle shows the opposite, indicating bearish pressure.
Mastering the candlestick charting basics gave me a foundation to start reading price action with more confidence. Understanding what Japanese candlesticks represent is the first step to unlocking patterns and signals that traders rely on to make smarter decisions.
How I Learned How to Read Japanese Candlesticks
After mastering the candlestick charting basics, I realized the real challenge was putting theory into practice, learning how to read Japanese candlesticks effectively. At first, it felt overwhelming with so many candles, patterns, and timeframes to consider. But breaking it down step-by-step helped me tremendously.
The first thing I did was focus on one candle at a time. Instead of trying to analyze a whole chart all at once, I zoomed in and studied individual candles carefully, their bodies, wicks, and colors. This simple step was crucial in understanding how to read Japanese candlesticks in real market conditions.
Next, I practiced how to read Japanese candlesticks on historical charts. Using platforms like FXPro, I looked back at past price action to identify familiar candlestick formations and observe what happened afterward. This approach showed me that price patterns tend to repeat, boosting my confidence.
To help myself remember, I took screenshots and added notes highlighting patterns I recognized. For example, I would circle a hammer pattern and write down, “Price bounced after this.” This active note-taking deepened my understanding of how to read Japanese candlesticks beyond just theory.
Finally, I started with longer timeframes like daily charts rather than very short intervals. The slower pace made it easier to grasp the meaning behind each candle and see the bigger market picture.
By focusing on one candle, practicing on past charts, and engaging actively, I steadily improved my skill in how to read Japanese candlesticks — and you can too!
Practical Tips That Helped Me Master Candlestick Charting
After realizing the common mistakes I made, I focused on practical ways to improve my skills with Japanese candlesticks. Here are some tips that helped me—and can help you—master candlestick charting faster and more confidently.
1. Start with the Basics and Build Up
When I began, I concentrated on the candlestick charting basics and the most common candlestick patterns. Trying to learn every single pattern at once was overwhelming. Instead, I focused on a handful of reliable patterns like hammer, doji, and engulfing candles. This made it easier to recognize patterns in real-time and understand what the market was telling me.
2. Practice Regularly by Reviewing Historical Charts
One of the best ways I learned was by going back and reviewing historical charts. I looked for examples of common patterns in different market conditions and timeframes—especially the 1-hour charts I trade on. This helped me see how patterns played out and improved my confidence in spotting them live.
3. Keep a Trading Journal
I started keeping a journal where I recorded each trade based on candlestick patterns—why I entered, what pattern I saw, and what happened afterward. This practice helped me learn from both my wins and losses. It’s a powerful way to improve and understand how to read Japanese candlesticks better over time.
4. Use Demo Accounts to Practice Without Risk
Before putting real money on the line, I practiced spotting patterns and making trades in a demo account. This allowed me to make mistakes and learn without the pressure of losing capital. If you want to learn candlestick patterns fast, demo trading is a safe and effective way to get comfortable.
5. Combine Candlestick Patterns with Other Analysis Tools
Candlesticks tell a story, but combining them with other tools like support and resistance, moving averages, or volume made my setups stronger. This extra confirmation helped me avoid false signals and boosted my win rate.
6. Be Patient and Stick to Your Plan
Finally, I learned that patience and discipline are key. I didn’t try to trade every pattern I saw—instead, I waited for clear setups and respected my entry and exit rules. This mindset helped me avoid impulsive trades and steadily improve my results.
Mastering how to read Japanese candlesticks and applying these practical tips made a huge difference in my trading journey. Remember, it’s a skill you develop over time with consistent effort.
How I Learned to Recognize Candlestick Patterns Fast and the Importance of Wicks
One of the biggest breakthroughs for me was figuring out how to learn candlestick patterns fast without getting overwhelmed by the sheer number of formations out there. The key was focusing on a few powerful patterns first and really understanding what the candles were telling me about the battle between buyers and sellers.
A crucial part of this process was understanding candlestick wicks — those thin lines extending above or below the candle body. I realized that wicks hold a lot of information about market sentiment. For example, a long lower wick (like on a hammer) shows that sellers pushed the price down during the session, but buyers stepped in and drove it back up before the close. Similarly, a long upper wick (like on a shooting star or inverted hammer) tells me that buyers tried to push prices higher, but sellers fought back.
Once I grasped the significance of wicks, it became much easier to read the story behind each candle. Instead of just memorizing patterns, I learned to interpret the tug-of-war happening between bulls and bears within every bar.
To speed up the learning process, I focused on these core steps:
-
Start with the most common candlestick patterns that appear frequently across markets.
-
Pay special attention to the size and position of the wicks — they’re often the difference between a strong signal and a weak one.
-
Practice by reviewing historical charts and spotting these patterns in context, not just in isolation.
-
Keep a journal of patterns I found and what happened afterward to reinforce learning.
By zeroing in on the wicks and understanding what they reveal, I was able to learn candlestick patterns fast and use that knowledge to make better trading decisions.
Common Candlestick Patterns That Helped Me Understand the Market
Once I got comfortable with how to read Japanese candlesticks, I focused on learning the common candlestick patterns that traders rely on. These patterns helped me identify market sentiment shifts and potential price reversals or continuations. Here are some of the most common candlestick patterns I found especially useful, including examples relevant for forex and other markets.
Hammer Pattern
 The hammer is one of the most common candlestick reversal patterns and was a favorite early on in my learning journey. It has a small real body near the top of the candle and a long lower wick. I often saw hammers appear after a downtrend, signaling that buyers were starting to push back against sellers. In forex trading, the hammer helped me spot potential bottoms and prepare for bullish reversals.
Doji Pattern
 The doji candle is another common candlestick pattern that signifies indecision in the market. The open and close prices are virtually the same, resulting in a very small or nonexistent body. When I spotted a doji, especially after a strong trend, it was a warning that the current momentum might be weakening, possibly leading to a reversal. This pattern is prevalent across all markets, including forex.
Bullish Engulfing Pattern
 The bullish engulfing pattern is one of the most common candlestick reversal patterns I use regularly. It happens when a small bearish candle is followed by a larger bullish candle that completely “engulfs” the previous one. This pattern often signals a strong buying interest and potential trend reversal upward. In forex, I found it particularly useful during key support levels.
Shooting Star Pattern
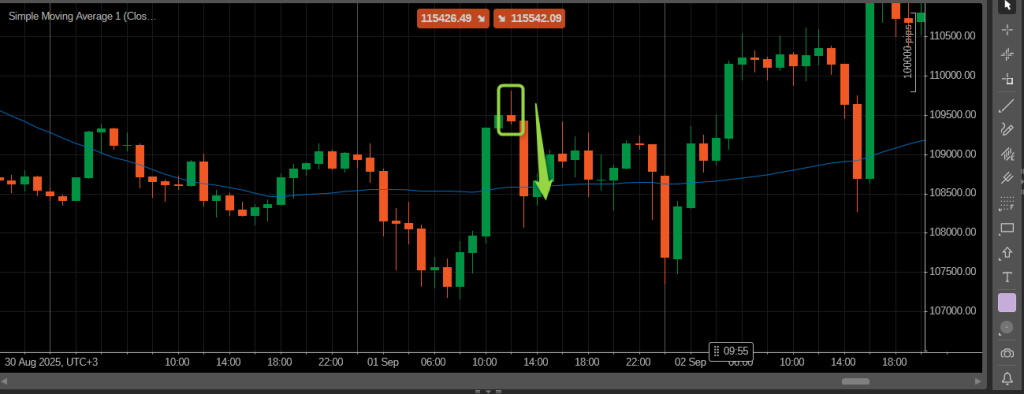 The shooting star is a bearish reversal pattern that caught my attention once I learned the common candlestick patterns forex traders watch closely. It has a small body near the bottom of the candle and a long upper wick, appearing after an uptrend. When I noticed this pattern, it signaled that sellers were gaining control, and the price might soon fall.
Inverted Hammer Pattern
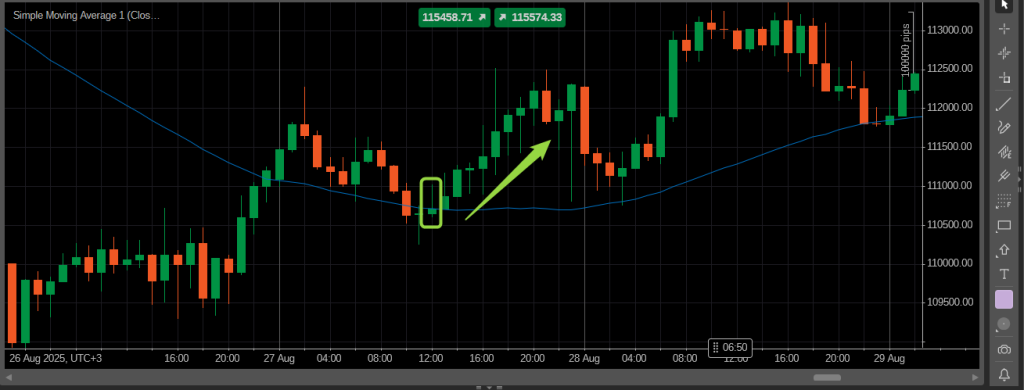
The inverted hammer looks similar to the hammer but with the long wick on top instead of the bottom. It usually appears after a downtrend and signals a possible bullish reversal. I learned that although the wick shows sellers pushing price down during the session, buyers regained control by the close — a subtle but important clue in how to read Japanese candlesticks.
Hanging Man Pattern
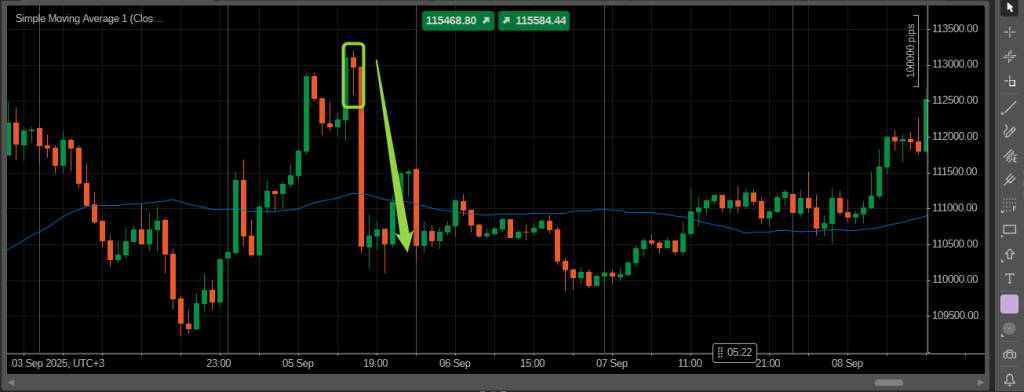 The hanging man resembles the hammer in shape but shows up after an uptrend, warning of a possible bearish reversal. When I noticed a hanging man, it told me that sellers had started to enter the market, even if buyers tried to keep prices high. This pattern helped me become more cautious about holding long positions.
By mastering these common candlestick patterns, I gained a clearer picture of market psychology and improved my timing. Whether you’re trading forex, stocks, or crypto, these patterns are foundational tools that can help you read price action more effectively.
Common Mistakes I Made When Trading Candlestick Patterns (and How to Avoid Them)
When I first started using Japanese candlesticks and trying to trade based on patterns, I made plenty of mistakes, some costly, others just frustrating. Looking back, I realize these errors are pretty common, so I want to share them with you to help you avoid the same pitfalls.
1. Jumping in Without Confirmation
One of my biggest mistakes was acting on a single candlestick pattern without waiting for confirmation. For example, I’d see a hammer or bullish engulfing and immediately enter a trade, only to find the price didn’t move as expected. Now, I always look for additional signals, like support levels holding, volume spikes, or trendline breaks, before committing.
2. Ignoring the Bigger Picture
Early on, I focused too much on individual candlesticks without considering the overall trend or market context. Candlestick patterns are powerful, but they don’t work in isolation. I learned to combine them with trend analysis and higher timeframe charts to avoid false signals.
3. Overtrading Based on Patterns Alone
It was tempting to trade every pattern I saw, thinking more trades meant more chances to win. But I quickly realized that not all patterns are equally reliable, especially in choppy or sideways markets. This led to losses and burnout. I now focus only on high-probability setups and wait patiently for the right opportunities.
4. Misreading Candlestick Wicks
I also struggled with understanding candlestick wicks at first. I’d overlook their significance or misinterpret long wicks, which sometimes led me to wrong conclusions about buyer and seller strength. Taking time to study wick behavior and price rejection really helped me improve my reading of patterns.
5. Neglecting Risk Management
Perhaps the most costly mistake was neglecting stop losses or risking too much on single trades based on candlestick signals alone. Patterns can fail, and without proper risk controls, losses add up fast. Setting clear stop-loss points and respecting them is now a non-negotiable part of my strategy.
By recognizing and addressing these mistakes, I gradually became a more disciplined and effective trader. If you’re starting out, keep these lessons in mind — learning from mistakes is part of the journey, but avoiding common traps can save you a lot of frustration and money.

Looking back, learning how to read Japanese candlesticks was a game-changer for my trading. Starting with the candlestick charting basics and gradually mastering the most common candlestick patterns helped me see the market from a clearer perspective. Understanding the story behind each candle and its wicks gave me valuable insights into buyer and seller battles.
Along the way, I learned that patterns alone don’t guarantee success. Combining candlestick signals with other analysis tools, waiting for confirmation, and always managing risk are essential to trading with confidence.
If you’re just starting out, focus on learning patterns step-by-step and practice regularly, especially on your preferred timeframe like the 1-hour chart. Keep a trading journal, use demo accounts, and don’t rush the process—learning candlestick patterns fast is about quality, not just speed.
Most importantly, stay patient and disciplined. The market will always test your emotions, but with a solid understanding of candlestick charting and a clear strategy, you’ll be better equipped to navigate its ups and downs.
I hope this guide helps you on your trading journey. Remember, every expert was once a beginner—keep practicing, stay curious, and enjoy the process of mastering candlestick charts.

