Markets entered October cautiously as investors digested fresh inflation and labor data from Europe and the United States, alongside persistent fiscal risks tied to the U.S. government shutdown. The dollar remains under pressure, while safe-haven demand supports gold and market participants keep a close eye on U.S. employment and manufacturing signals.
Key Data Releases to Watch Today
Below are some of the main economic releases listed for today (via ForexFactory and Investing) with their previous and forecast values:
- EUR Core CPI Flash Estimate y/y — Previous: 2.2% | Forecast: 2.3%
- USD ADP Non-Farm Employment Change — Previous: 54K | Forecast: 52K
- USD ISM Manufacturing PMI — Previous: 48.7 | Forecast: 49.0
These data points will shape expectations for inflation momentum in the euro area, labor market dynamics in the U.S., and consumption trends reflected in manufacturing. The inflation outlook in Europe directly feeds into ECB policy expectations, while U.S. employment and ISM figures play a critical role in the Fed’s policy path. Meanwhile, oil inventories continue to reflect the fragile balance between demand and supply.
EUR/USD
The euro is supported by inflation readings, with a slightly firmer CPI forecast highlighting that price pressures in the euro area remain persistent. This could add weight to arguments for the ECB to stay cautious on easing policy. In contrast, the U.S. faces softer employment signals, and with ADP jobs growth forecast weaker than before, pressure builds on the dollar, leaving EUR/USD sensitive to shifts in sentiment.
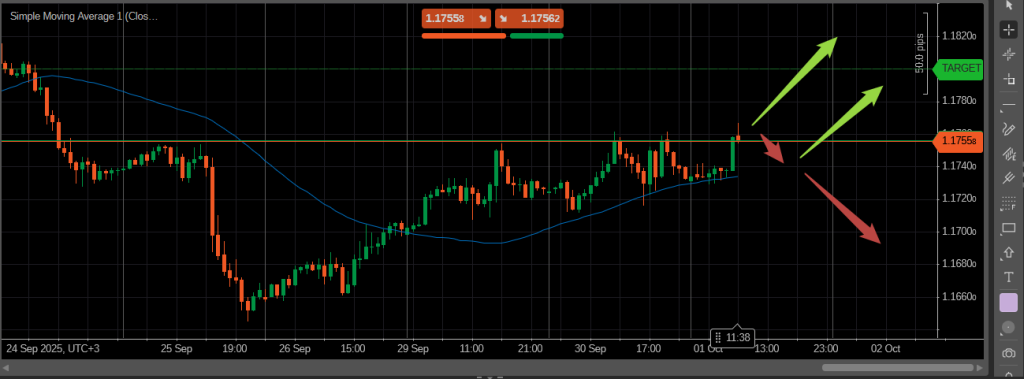
EUR/USD reached 1.1760 yeasterday and moved to the SMA50 again. Today, the buy zone is at 1.1760-1.1770. The second scenario is testing the SMA50 again. If the currency pair reach the moving average on the hourly chart, check for reversal patterns like hammer, bullish engulfing, spinning tops, etc to find reversal signals. if the breakout occurs, then it is better to sell.
Gold
Gold continues to find buyers amid ongoing uncertainty. Inflation signals from Europe and the risk of weaker U.S. labor data add to the safe-haven appeal of bullion. Combined with fiscal concerns around the U.S. shutdown, gold remains a key hedge in portfolios, benefiting from demand as investors seek stability.
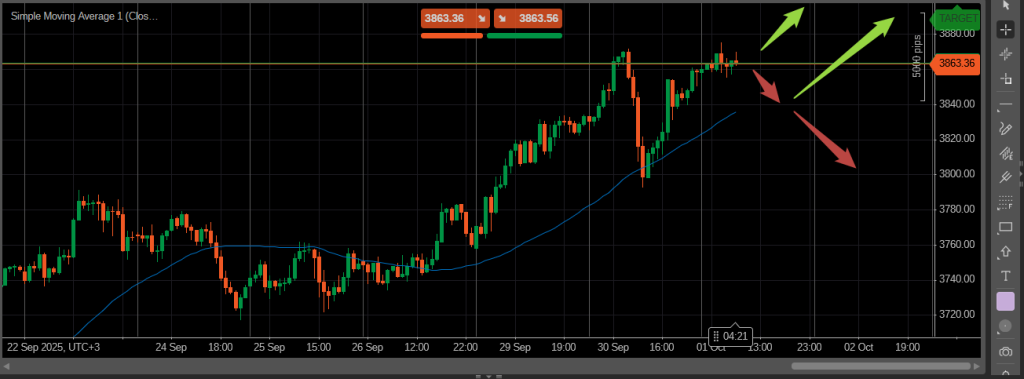
Gold is trading close to its ATH. The buy zone is at 3,880-3,890. In case of a correction to the SMA50 on the hourly chart, you can buy if a reversal candlesetick signal occurs. A confirmed downside breakout of the SMA50 will open a way to lower targets.
WTI Crude Oil
Oil traders are focused on U.S. inventories, with forecasts suggesting a notable build after last week’s draw. A higher-than-expected stockpile could reinforce concerns about demand weakness, especially if labor and manufacturing data disappoint. Conversely, a smaller build or a surprise drawdown would lend short-term support to crude prices, but fundamentals remain cautious.
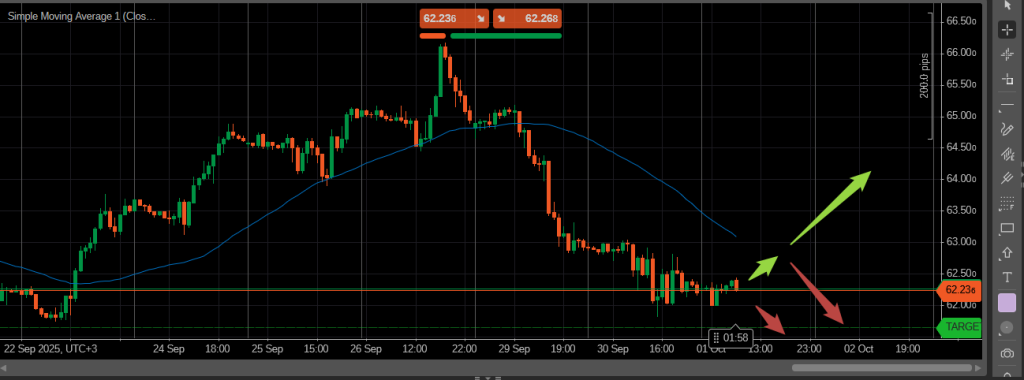
Oi is trading in a range today. The sell zone is at 61.80-61.70. In case of an upside correction to the SMA50, check for reversal signals like hanging man, shooting star or others for a reversal. In case of an upside breakout with confirmation, upper targets will be available.
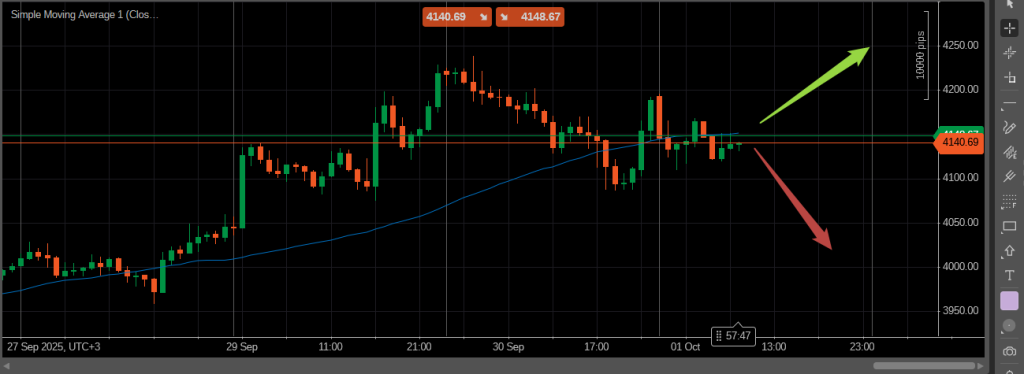
Bitcoin
Crypto markets remain sensitive to macro conditions and liquidity flows. Weaker U.S. employment data or dovish policy expectations could encourage speculative buying in Bitcoin, while persistent uncertainty around growth and fiscal stability may temper upside potential.
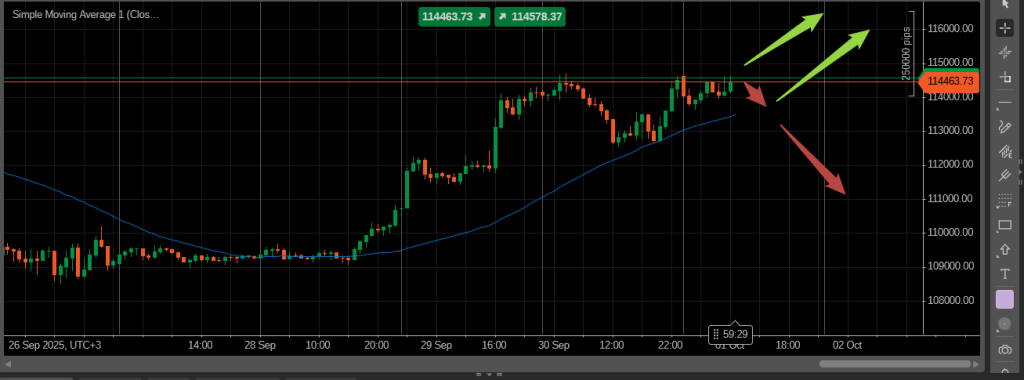
Bitcoin is trading close to its local highs. The first scenario is a breakout of the local resistance level with the buy zone at 114,800-115,000. If the currency pair moves to the SMA50 on the hourly chart, check for reversals. A clear downside breakout of the dynamic support will open lower targets.
Ethereum
Ethereum mirrors Bitcoin’s trajectory, lacking its own drivers for the moment. It remains heavily influenced by macroeconomic conditions and risk appetite. Inflation and labor signals will help dictate near-term flows, with investors watching for broader sentiment shifts across risk assets.
ETH/USD is trading close to the SMA50. A reversal from here will allow selling, while in case of an upside breakout, traders can buy above the SMA50 on the hourly chart.


