Markets opened cautiously as investors continue to weigh economic signals and central bank communication. The US dollar remains well supported by safe-haven flows and uncertainty around the fiscal outlook in Washington. European sentiment is muted after recent weak data, while Canadian and US economic indicators are closely watched for further signs of consumer and labor market trends.
Gold is steady amid elevated risk aversion. Oil trades sideways, with little change in supply expectations. Equities are mixed, reflecting investor hesitation ahead of key inflation and sentiment readings.
Key Data Releases to Watch Today
- CAD Employment Change: Previous: –65.5K | Forecast: 2.8K
- CAD Unemployment Rate: Previous: 7.1% | Forecast: 7.2%
- USD Prelim University of Michigan Consumer Sentiment: Previous: 55.1 | Forecast: 54.1
- USD Prelim University of Michigan Inflation Expectations: 4.7%
- USD FOMC Member Goolsbee Speech
- USD FOMC Member Musalem Speech
These releases are expected to influence market expectations around interest rates, growth resilience, and inflation. In particular, the consumer sentiment figures will be watched closely for signs of potential demand softness heading into year-end.
EUR/USD
The euro is trading with a defensive tone against the dollar as the US currency remains buoyed by risk aversion and firm yields. European traders await further clarity from US inflation data and central bank speakers before making directional bets.

EUR/USD is trading below the SMA50 on the hourly chart confirming the bearish bias. Selling is available from current levels or from the SMA50, buyings are recommended above the SMA50 after a strong confirmation of a breakout.
Closest support levels: 1.1540 and 1.1500
Closest resistance levels: 1.1600, 1.1640 and 1.1700
Gold
Gold remains firm, supported by ongoing geopolitical tensions and cautious global sentiment. With US data and Fed commentary on the calendar, investors will watch for shifts in rate expectations that could impact precious metals.
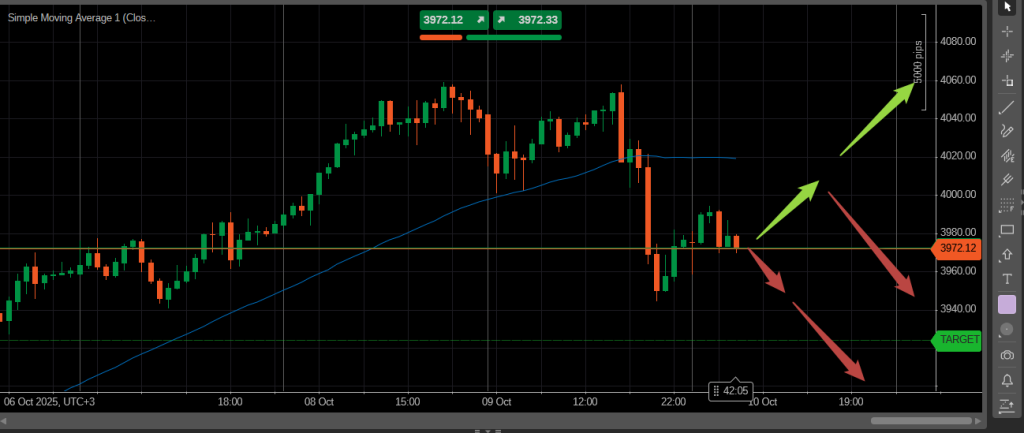
Gold is trading below the SMA50 on the hourly chart after yesterday’s significant downside movement. In case of a move towards the SMA50 on the hourly chart, check for reversal Japanese candlestick patterns or for a clear breakout with confirmation.
Closest support areas: 3,950, 3,920
Closest resistance areas: 4,000, 4,020, 4,060
WTI Crude Oil
Oil prices are stable, with traders assessing a balanced outlook between steady supply and concerns around weakening global demand. Market participants continue to monitor geopolitical developments and economic signals from major importers.
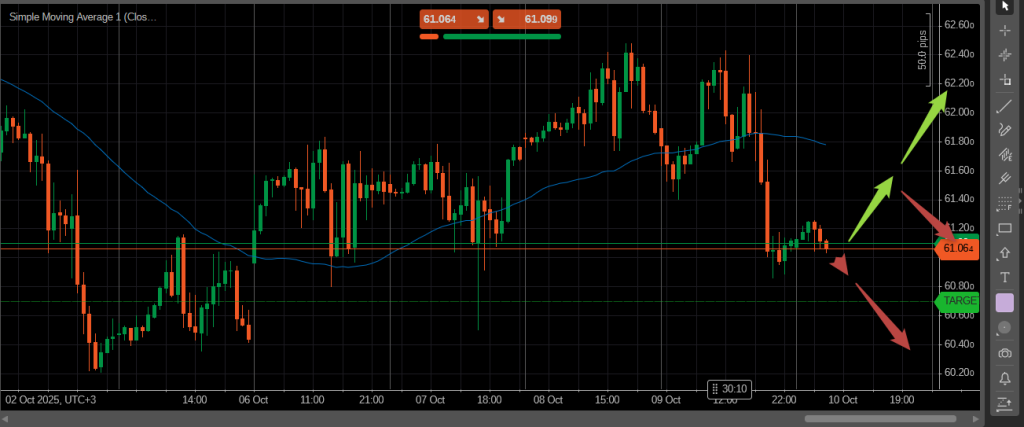
WTI is trading below the SMA50 with a strong downside pressure. In case of a movement towards the SMA50, check for Japanese candlestick reversal patterns or a strong breakout.
Closest support levels: 60.90, 60.40
Closest resistance levels: 61.30, 61.80, 62.30
Bitcoin
Bitcoin is trading close to recent highs, holding firm in the face of broader market volatility. Interest remains supported by institutional participation and its perceived role as a hedge amid economic uncertainty.

Bitcoin is trading below the SMA50 and is going to text the dynamic resistance. Here, you should check for reversal patterns or a clear breakout.
Closest support levels: 121,000, 119,600
Closest resistance levels: 122,000, 123,500, 126,000
Ethereum
Ethereum follows Bitcoin’s path, consolidating with little directional bias. Market players remain in wait-and-see mode, looking for cues from broader risk sentiment and macroeconomic trends.

Ethereum is trading close to the SMA50 on the hourly chart. In case of the test of the dynamic resistsance level, pay attention to reversal signals or wait for a breakout with confirmation.
Closest support levels: 4,260, 4,200
Closest resistance levels: 4,400, 4,500, 4,560


