
Markets are cautious on Wednesday as traders await key UK inflation figures, central bank speeches, and the latest U.S. crude oil inventory report. The global risk tone remains fragile amid limited U.S. data availability due to the ongoing government shutdown and renewed concerns about global growth.
Key Data Releases to Watch Today
- GBP CPI y/y: Previous: 3.8% | Forecast: 4.0%
- JPY Trade Balance: Previous: –0.17T | Forecast: –0.11T
- NZD GDT Price Index: Previous: –1.4% | Forecast: –1.6%
- USD Crude Oil Inventories: Previous: +2.2M | Forecast: +3.5M
IMPORTANT NOTE:
U.S. data availability remains limited as the government shutdown continues to affect federal releases.
Central Bank Speakers Today
- ECB: Christine Lagarde (President)
- Fed: Michael S. Barr (Vice Chair for Supervision)
- BoE: Catherine Mann
- BoJ: Kazuo Ueda
- Global: IMF and World Bank meetings continue
EUR/USD
The euro is awaiting key remarks from ECB President Christine Lagarde, expected to provide guidance on the timing of potential rate cuts. Market participants are looking for any acknowledgment of softening inflation trends or weaker economic outlooks in the Eurozone. A dovish tone could pressure the euro, while any signs of policy patience may stabilize it ahead of next week’s data releases.

EUR/USD is trading near 1.1615 and is approaching a key short-term resistance around 1.1620–1.1630. The pair is attempting to recover from a recent downtrend, but price remains below the SMA50, indicating that bears are still in control on the hourly chart. A sustained break above 1.1630 could trigger a corrective move toward the SMA50 near 1.1660–1.1670, potentially extending toward 1.1700 if bullish momentum strengthens. Conversely, failure to break above 1.1630 may lead to renewed selling pressure, targeting support near 1.1600 and 1.1580.
Closest support levels: 1.1600, 1.1580
Closest resistance levels: 1.1630, 1.1660, 1.1700

GBP/USD
All eyes are on the UK inflation data today. Both headline and core CPI are expected to show slight rise. A higher-than-expected reading could boost the pound as traders would price in a longer period of restrictive policy. Conversely, a softer figure could increase expectations of a rate cut in early 2026.
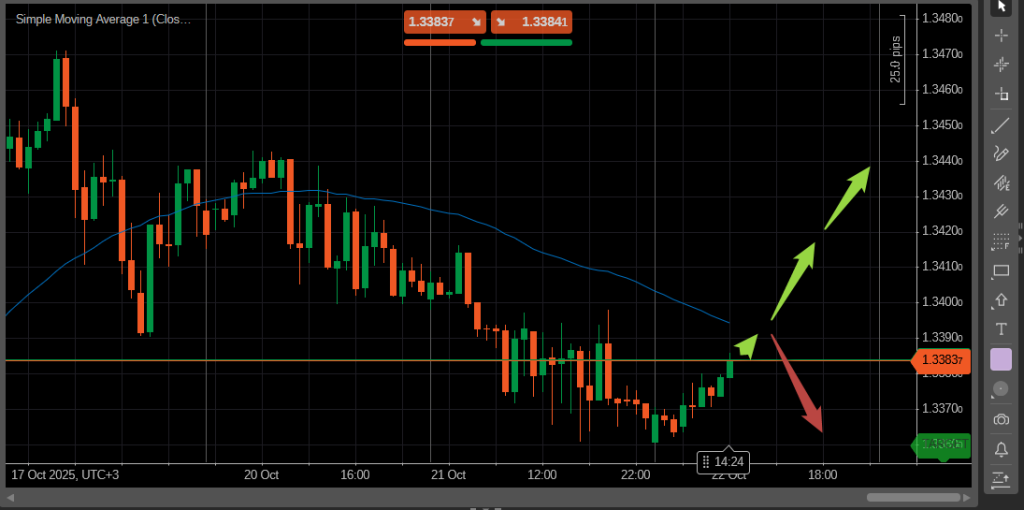
GBP/USD is trading near 1.3384 and is approaching short-term resistance around 1.3385. The pair is currently attempting to break above this level, while remaining below the SMA50 on the hourly chart. A sustained move above 1.3400–1.3420 could signal a bullish breakout, targeting further resistance near 1.3440. Conversely, failure to hold above 1.3385 could trigger a retracement toward the recent support near 1.3370. Watch for candlestick patterns or momentum signals near these levels to confirm potential direction.
Closest support levels: 1.3370, 1.3350, 1.3330
Closest resistance levels: 1.3400, 1.3420, 1.3440
Gold
Gold remains steady as investors await comments from Fed Vice Chair Michael Barr. With the U.S. government shutdown limiting data visibility, traders are relying more on central bank guidance. Any hawkish tone from the Fed could weigh on gold, while dovish hints or uncertainty around fiscal developments may continue to support safe-haven demand.
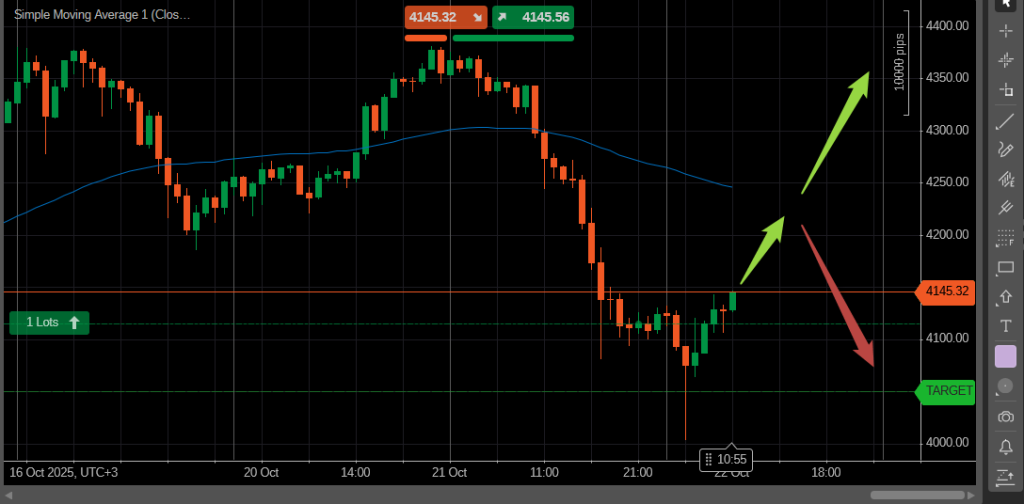
Gold is trading around 4,145 and is testing a short-term resistance level. The price has retraced sharply from recent highs near 4,155 and is currently attempting to recover. On the hourly chart, price is still below the SMA50, indicating the overall short-term trend remains bearish.
The current setup shows potential for a short-term upside move if price breaks above 4,145–4,150 resistance, targeting 4,180–4,200. However, if this resistance holds, the market may continue its downward trend toward the 4,100–4,080 support zone.
Buyers need to see a sustained move above 4,150 to regain control, while sellers could push prices lower if the resistance holds. A break above 4,200 could open the way toward 4,250 and higher.
Closest support levels: 4,120, 4,100, 4,080
Closest resistance levels: 4,145, 4,180, 4,200
WTI Crude Oil
Oil markets focus on the upcoming U.S. crude inventory report, expected to show another weekly build. The figure could signal easing demand in the short term, pressuring prices unless offset by optimism about OPEC+ production management. Broader sentiment remains cautious, with traders watching U.S. and Chinese demand indicators closely.
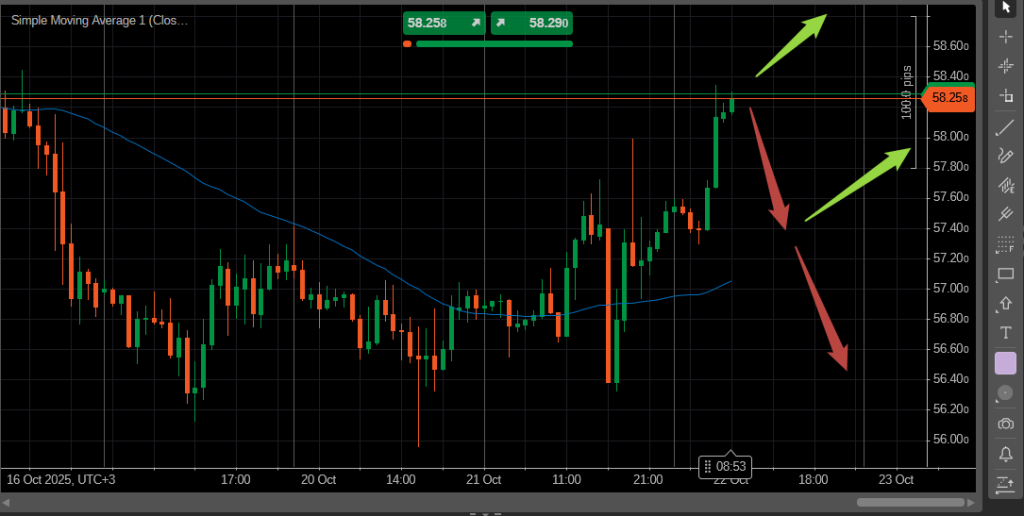
WTI crude is trading near 58.25 and has recently tested resistance just above the SMA50, showing a strong upward push after earlier consolidation. The market is at a critical juncture: a breakout above the current resistance could open the way toward 58.60 and higher, while a rejection could trigger a pullback toward support levels. Momentum is currently bullish, but caution is warranted near this key zone.
Closest support levels: 57.80, 57.40, 56.60
Closest resistance levels: 58.60, 58.90, 59.20
Bitcoin
Bitcoin remains range-bound as global risk appetite fluctuates. The lack of fresh U.S. economic data has reduced short-term drivers, leaving crypto sentiment tied to liquidity trends and regulatory developments. Market participants await further clarity from global regulators and the IMF’s ongoing discussions on digital assets this week.
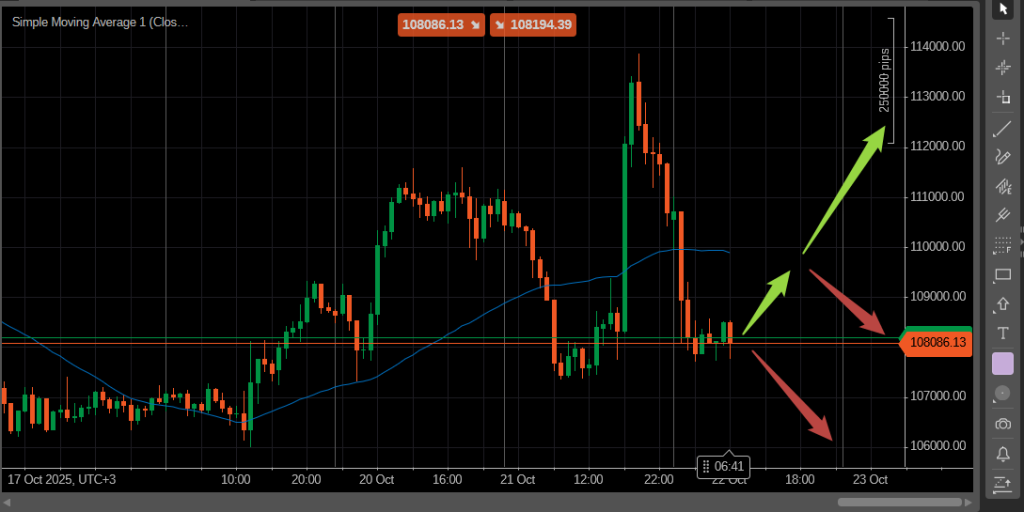
Bitcoin is under pressure, consolidating near 108,000 after a sharp drop from recent highs. The price is currently testing a key support zone around the current level, showing indecision among market participants. A rebound from this zone could lead to a retest of resistance near the SMA50 and above, while a sustained break below support may trigger further downside.
Closest support levels: 107,600; 106,000; 104,200
Closest resistance levels: 108,800; 110,000; 111,800
Ethereum
Ethereum mirrors Bitcoin’s cautious tone, with investors awaiting signals from the broader risk environment. Institutional flows remain subdued ahead of key regulatory updates and macro speeches. Any improvement in risk sentiment following central bank comments could provide short-term support for digital assets.
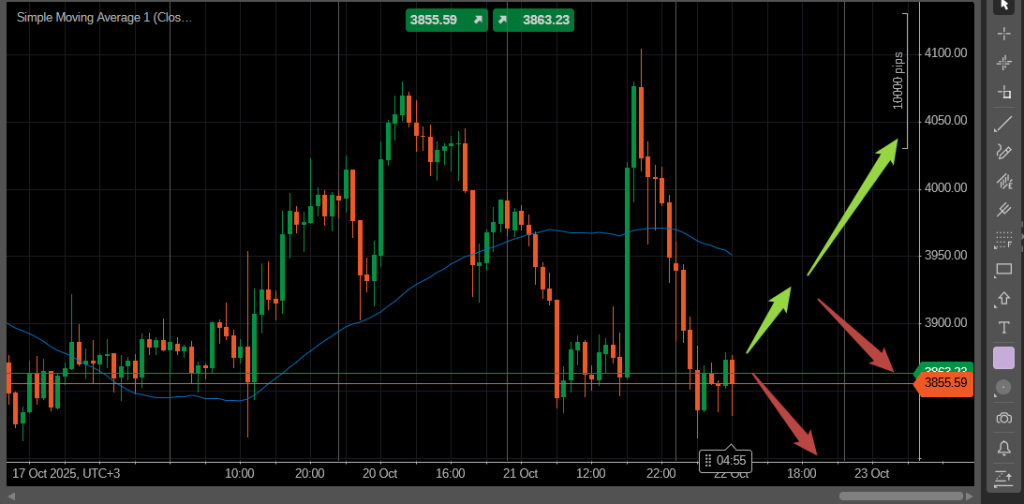
Ethereum is consolidating around 3855 after recent attempts to climb above 3900–4000 failed. The price is hovering near the SMA50, showing indecision between bulls and bears. A successful rebound above the current level could retest resistance near 3920–4000, while a break below the 3850 support zone may open the path to deeper declines.
Closest support levels: 3820, 3750, 3670
Closest resistance levels: 3920, 4000, 4070


