The past week was dominated by the U.S. Federal Reserve’s decision to cut interest rates by 25 basis points, a move that rippled across currencies, commodities, and crypto markets. Traders reacted not only to the rate cut itself but also to Jerome Powell’s cautious tone, which left future policy moves dependent on incoming data. Now, as we step into a new week, attention shifts to a heavy calendar of U.S. economic releases, culminating with the core PCE inflation report on Friday. These numbers will shape expectations for further rate moves, and with them, the direction of EUR/USD, Gold, WTI, Bitcoin, and Ethereum.
EUR/USD
Last week, EUR/USD touched a four-year high near 1.1918 before retreating toward the 1.1750–1.1770 range. The dollar regained strength after the Fed’s rate cut, supported by rising U.S. yields and firmer data, though the euro found support near 1.1720 before bouncing back into the weekend. In the days ahead, the spotlight falls on U.S. inflation data. A stronger-than-expected PCE reading could fuel further dollar gains and put pressure on the euro, while softer inflation may give EUR/USD fresh momentum to the upside.
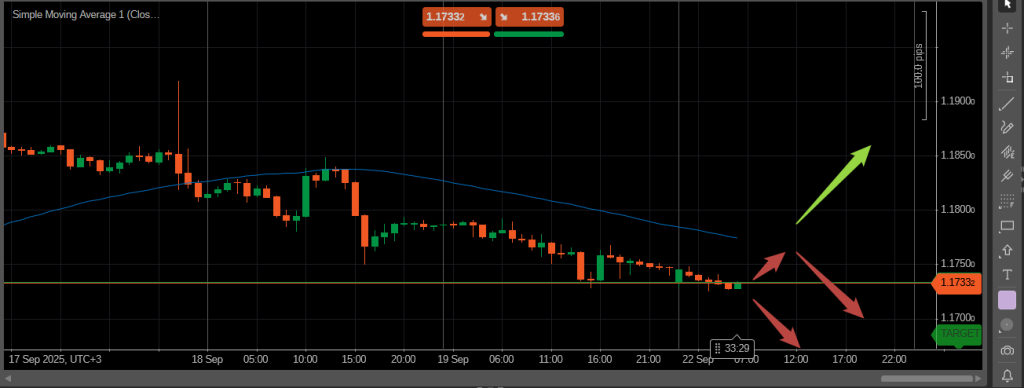
From a technical perspective, EUR/USD is currently trading below the 50-period SMA on the hourly chart, which keeps the bearish scenario as the dominant outlook for today. The preferred sell zone is between 1.1720 and 1.1710. If the pair moves higher to retest the 50-SMA, traders should watch for potential reversal signals, such as a shooting star or a bearish engulfing pattern, to confirm short entries.A shift toward a bullish scenario would require a decisive break above the 50-SMA on the hourly chart. Ideally, this would be accompanied either by strong upward momentum during the breakout or by a successful retest of the SMA50 from above, validated by bullish reversal signals such as a hammer, inverted hammer, or bullish engulfing pattern.
Gold
Gold rallied to new highs above $3,700 per ounce following the Fed’s move, as traders embraced the prospect of easier monetary conditions. Yet the rally quickly cooled after Powell emphasized a cautious, data-driven approach, while rising U.S. yields added pressure and the dollar found its footing. Gold still ended the week elevated, and the next big test will come with the PCE data. A softer reading could push gold higher, but if inflation proves sticky, the metal may struggle to extend its rally.
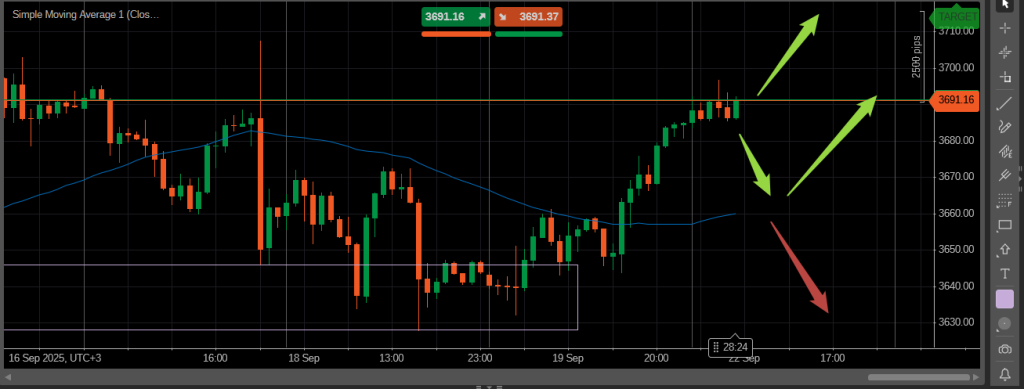
Gold continues to trade above the 50-period SMA on the hourly chart, supported by the current environment of lower interest rates that keeps the metal among the most attractive assets. The immediate buy zone is located between 3,700 and 3,710. In the event of a retest of the 50-SMA, long positions would remain preferable if a clear reversal signal appears at this dynamic support. However, if gold breaks decisively below the 50-SMA, the technical picture would shift, and short positions could come into play.
WTI Crude Oil
Oil prices finished the week slightly lower, even with a sharp draw in U.S. inventories that normally would have lifted the market. Concerns about sluggish demand, weak refinery runs, and a generally well-supplied market outweighed bullish signals. While geopolitical risks occasionally provided support, sentiment remained cautious overall. This week, traders will be watching new inventory reports, refining activity, and potential disruptions in supply. Unless demand indicators show improvement, crude may continue to trade under pressure.
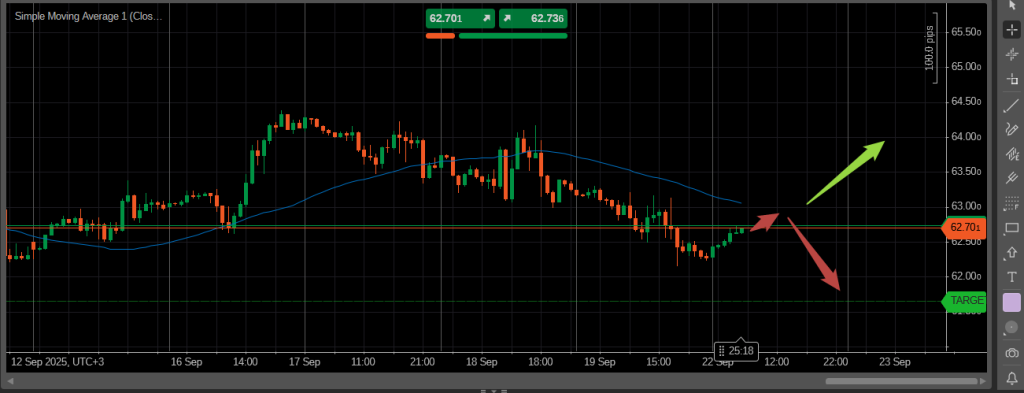
Crude oil is approaching the 50-period SMA on the hourly chart, which is likely to become the key battleground between buyers and sellers in the coming hours. If the price tests this level and forms a reversal signal, short positions would be preferable. However, if a strong breakout occurs above the SMA50, the technical outlook would shift in favor of long positions.
Bitcoin
Bitcoin experienced heightened volatility as a record $4.3 billion in options expired, amplifying price swings. Profit-taking added to the turbulence, though the broader outlook remains constructive, supported by expectations of looser U.S. monetary policy. In the days ahead, Bitcoin’s direction will likely hinge on macroeconomic data. Softer inflation and dovish Fed commentary could lift BTC, while hawkish surprises may trigger further pullbacks.
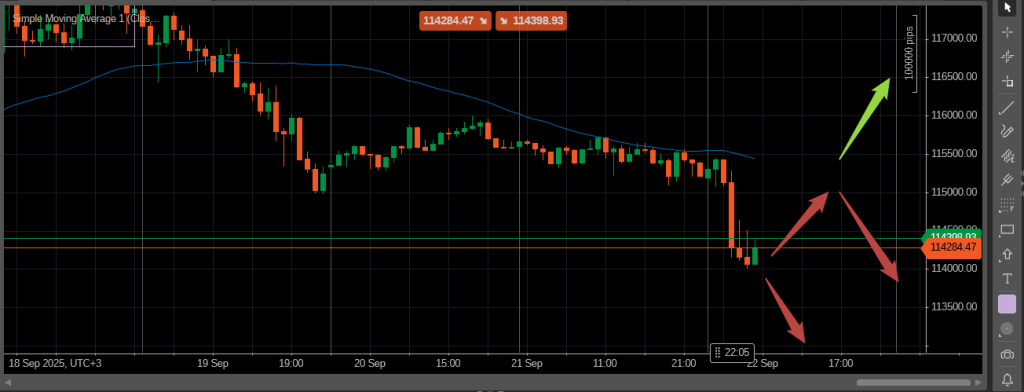
Bitcoin plunged on Friday after initially breaking above the 50-period SMA on the hourly chart. While the short-term outlook remains bearish, there are also potential bullish opportunities. The primary sell zone is between 114,000 and 113,700, and short positions could also be considered from the SMA50 if a clear reversal signal appears. On the bullish side, long positions would be preferable if the price breaks decisively above the SMA50 with strong momentum. Currently, the inverted hammer pattern offers a promising buying opportunity, suggesting a potential upward correction.
Ethereum
Ethereum followed Bitcoin’s choppy path but showed resilience, helped by institutional inflows and continued demand from staking and DeFi activity. The large options expiry event fueled intraday swings, though positioning appeared less bearish compared to Bitcoin. Ethereum’s trajectory this week will largely mirror the broader risk environment shaped by U.S. inflation numbers and Fed signals. Positive macro surprises could underpin further gains, while stronger inflation data may stall momentum.
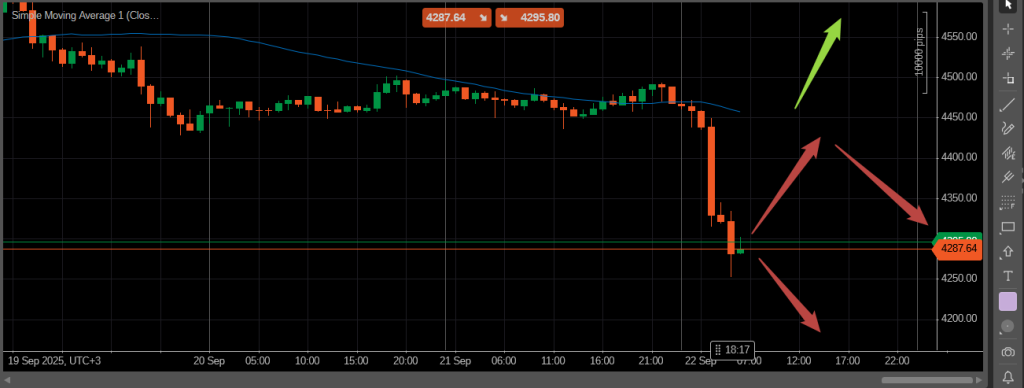
Ethereum is currently trading below the 50-period SMA on the hourly chart, keeping the short-term outlook bearish. The preferred sell zone for today is between 4,250 and 4,230. If the price moves higher to retest the 50-SMA from below and a reversal signal appears, short positions would remain the priority. However, if Ethereum manages to break decisively above the SMA50, the technical picture would shift, and long positions would become preferable.


