Markets opened Thursday with a cautious tone as investors remained focused on the escalating risk of a U.S. government shutdown and mixed global growth signals. Political uncertainty kept the dollar subdued, gold held firm on safe-haven demand, oil struggled for clear direction, and cryptocurrencies continued to consolidate. Fresh U.S. data, alongside ongoing developments in Washington, are setting the tone for today’s session.
Key Data Releases to Watch Today
U.S. Durable Goods Orders (August): previous -2.8%, forecast -0.3%
U.S. Unemployment Claims: previous 231K, forecast 233K
U.S. New Home Sales (August): previous 4.01M, forecast 3.96M
U.S. Final GDP (Q2): previous 3.3%, forecast 3.3%
EUR/USD
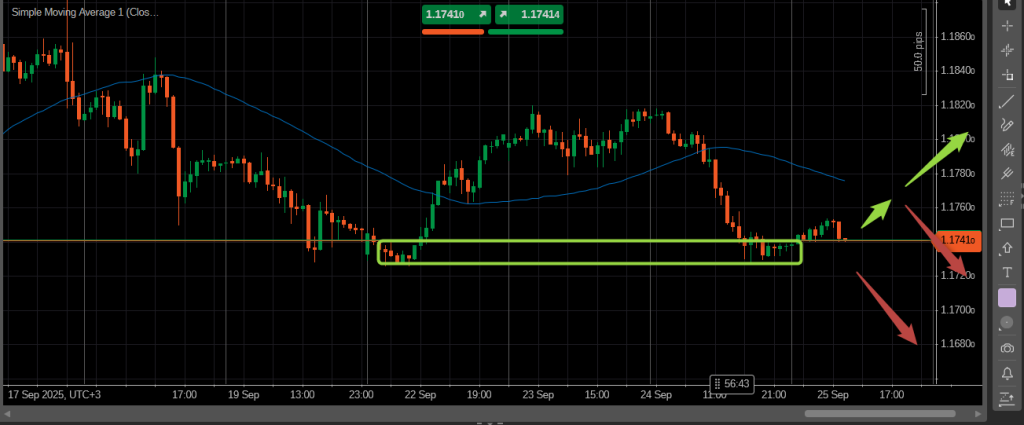
The euro remains supported by better-than-expected flash PMI data earlier this week, which showed resilience in Germany’s services sector. However, slowing manufacturing momentum across the eurozone remains a drag. The dollar stays vulnerable as investors weigh fiscal gridlock in Washington, with shutdown fears adding downside pressure. Today’s U.S. durable goods, GDP, and housing data will be decisive in shaping near-term flows.
We are close to a quite a strong support zone, therefore, I would suggest selling from below 1.1720 if a downside breakout is confirmed. If the currency pair moves to the SMA50, then you can sell from there in case of a reversal. Long positions will be preferable in case of the upside breakout with confirmation.
Gold
Gold continues to trade near record highs as safe-haven flows intensify amid U.S. political uncertainty. With the White House instructing agencies to prepare mass firing plans in case of a shutdown, demand for defensive assets remains elevated. Stronger U.S. GDP and durable goods data could temporarily cap gains, but overall risk aversion keeps the outlook supported.
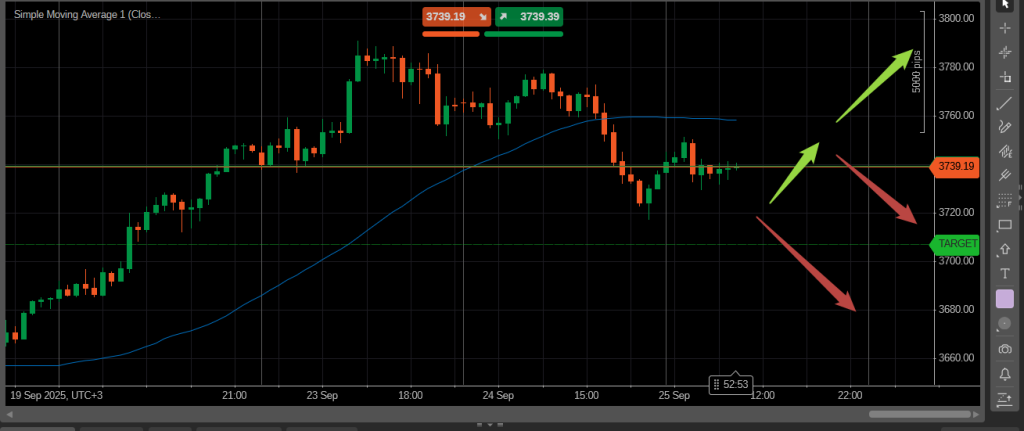
Gold is trading close to the SMA50. Yesterday, it moved below the moving average on the hourly chrt. If gold continues to plunge, the sell zone will be at 3,710-3,700. Also, in case of a retest of the SMA50 and a reversal signal, sell gold from there. A breakout will open road for targets above like 3,800+.
WTI Crude Oil
Crude oil trades sideways as the market weighs supply risks against concerns about slowing demand. Durable goods and GDP readings in the U.S. will provide further clues about industrial consumption trends, with weaker data likely to reinforce worries of slowing demand, while stronger results could lend temporary support.
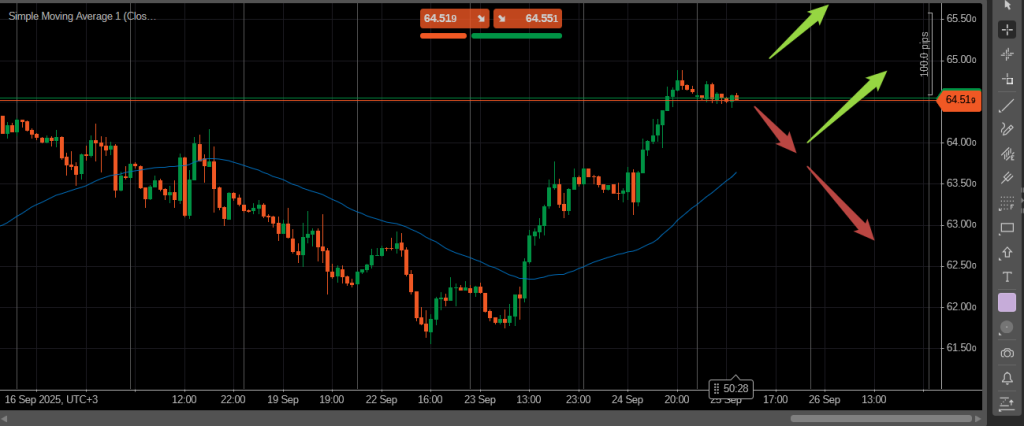
WTI is trading in a tight range and in case of an upside breakout, the buy zone will be at 64.90-65.00. Also, long positions will be preferable from the SMA50 if a bullish reversal signal occurs. Selling will be relevant in case of a downside SMA50 breakout on the hourly chart.
Bitcoin
Bitcoin remains range-bound after recent volatility, with traders reluctant to commit ahead of key U.S. macro releases. Risk sentiment tied to shutdown uncertainty continues to be the main driver. Stronger-than-expected GDP or durable goods numbers could limit crypto upside, while softer prints may encourage renewed buying interest in digital assets.
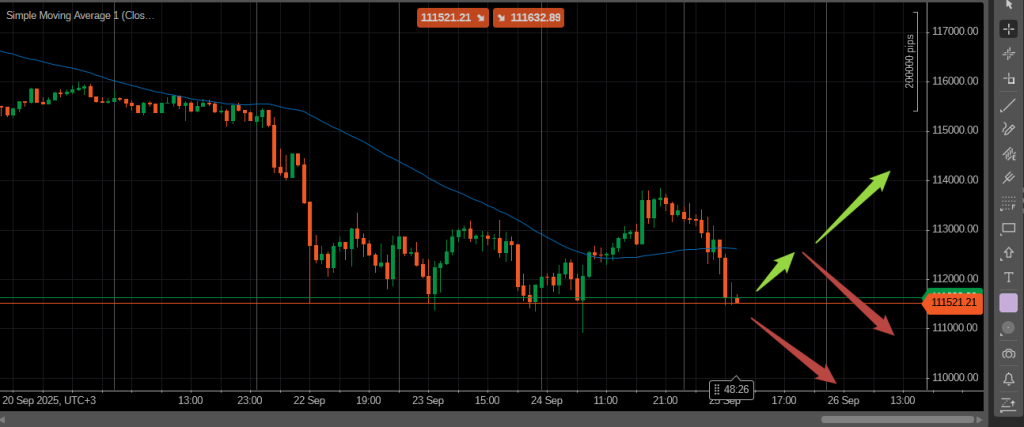
A crucial moment for BTC. We are close to a significant support zone and in case of a downside breakout, a strong momentum may come. The Sell zone today is at 111,000. If it moves to the SMA50 with a bearish reversal signal, you can also sell. An upside breakout of the SMA50 on the hourly chart will open the way to 114,000+.
Ethereum
Ethereum mirrors Bitcoin’s consolidation, with institutional flows keeping a floor under prices but no clear catalyst for a breakout. Short-term direction will hinge on today’s U.S. GDP, housing, and durable goods reports, as well as the broader risk environment shaped by Washington politics.
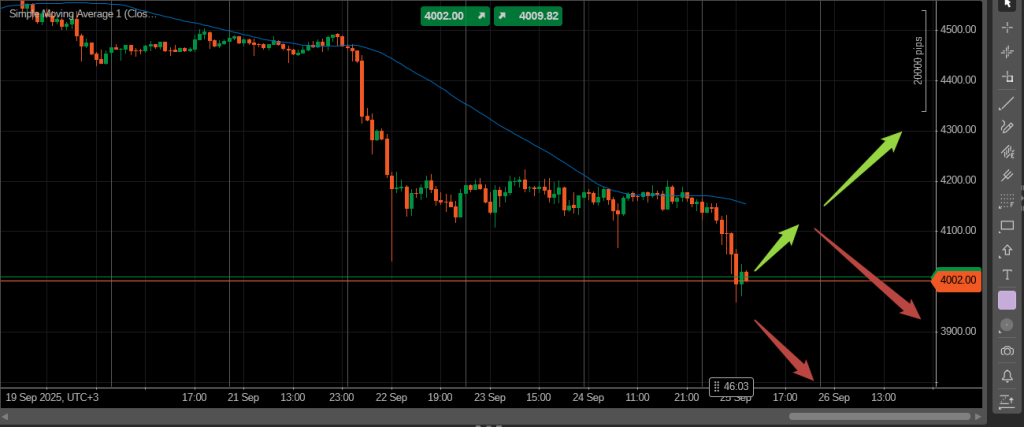
Ethereum made a downside breakout yesterday but currently the downside has stopped. I would sugest selling below 39.50 or if the SMA50 will be tested and a bearish reversal signal occurs. Buyings will be preferable above the SMA50 in case of a confirmed breakout


