1. Range-Bound Trading: How to Identify, Trade, and Profit from Sideways Markets
  2. Trend-Following vs Counter-Trend Strategies: Understanding Two Opposite Trading Approaches
  3. Daily Market Review, November 6, 2025
  4. Correlation in Trading: How to Use Market Relationships to Improve Your Strategy
  5. Tweezer Tops and Bottoms: How to Identify and Trade These Powerful Candlestick Patterns
  6. Mastering Trendlines in Trading: A Complete Guide to Drawing, Using, and Profiting from Trendlines in Forex, Crypto, and Stocks
  7. High Probability Breakout Trading Strategies: The Complete Guide for Day Traders
  8. Top 10 Rules for Successful Trading
  9. Daily Market Review, October 22, 2025
  10. Daily Market Review, October 21, 2025
  11. Trading for Beginners: Simple Strategies, Tips, and a Complete Starter Guide
  12. Mastering the Risk-Reward Ratio in Trading: A Complete Guide for Traders
  13. Top Swing Trading Strategies: A Complete Guide for Stocks, Forex, and Crypto
  14. Daily Market Review, October 17, 2025
  15. The Best Day Trading Strategies for Forex: Profitable Techniques That Actually Work
  16. Daily Market Review, October 16, 2025
  17. Forex Trading Deposits: Minimum Requirements & How to Fund Your Account
  18. Mastering the Simple Moving Average in Trading: Strategies, Signals, and Use Cases
  19. Daily Market Review, October 14, 2025
  20. Daily Market Review, October 13, 2025
  21. What is a Sell Stop in Forex? Explained with Examples
  22. Buy Stop Orders in Trading: What They Are, How They Work, and When to Use Them
  23. Daily Market Review, October 10, 2025
  24. MACD Indicator Explained: How It Works, How to Read It, and the Best Settings for Trading Success
  25. Daily Market Review, October 9, 2025
  26. Master the SMA50 Reversal Strategy with Candlestick Patterns on FXPro cTrader: A Step-by-Step Guide
  27. Mastering Risk Management in Trading: Strategies to Protect Your Capital and Maximize Long-Term Success
  28. Daily Market Review, October 6, 2025
  29. Three Inside Up and Down Candlestick Patterns: How to Identify and Trade Reversals Effectively
  30. RSI Strategy for Forex and Crypto: A Step-by-Step Trading Guide
  31. How to Start Trading: A Step-by-Step Guide for Beginners with FXPro
  32. Daily Market Review, October 2, 2025
  33. Fakeouts in Trading: How to Spot and Avoid False Breakouts in High-Frequency and Low-Frequency Markets
  34. Daily Market Review, October 1, 2025
  35. Daily Market Review, September 30, 2025
  36. Bullish Engulfing Candlestick Pattern: How to Spot and Trade It
  37. Daily Market Review, September 29, 2025
  38. Spinning Tops Candlestick Pattern: How to Interpret Market Indecision in Trading
  39. Mastering Double Top and Double Bottom Patterns: Powerful Trading Strategies for Trend Reversals
  40. Mastering Support and Resistance: The Foundation of Technical Analysis
  41. Daily Market Review, September 26, 2025
  42. Doji Candlestick: The Market’s Moment of Hesitation
  43. Daily Market Review, September 25, 2025
  44. The Hidden Power of the SMA50 in Trading
  45. Daily Market Review, September 23, 2025
  46. Stop Losses in Trading: How I Protect My Capital and Manage Risk
  47. Hanging Man Candlestick Pattern: A Bearish Reversal Signal Every Trader Should Know
  48. Daily Market Review, September 22, 2025
  49. Shooting Star Candlestick Pattern: How to Identify, Trade, and Profit From It
  50. Hammer Candlestick Pattern Explained: How to Trade the Bullish Reversal Signal with Confidence
  51. Candlestick Chart Tutorial: My Step-by-Step Guide for Beginners

Benefit from your trading ideas now!

Join FXPro, one of the most reliable and trustworthy brokerages with European license now and capitalize on price fluctuations

Markets head into Friday with heightened focus on U.S. inflation dynamics, personal spending figures, and consumer sentiment data. Traders are also attentive to fresh remarks from Federal Reserve officials, which could shape expectations for the rate path into the final quarter of the year. Political uncertainty in Washington adds another layer of caution, while global investors continue to balance safe-haven demand with risk appetite.


Key Data Releases to Watch Today

U.S. Core PCE Price Index m/m (August): previous 0.3%, forecast 0.2%
U.S. Personal Income m/m (August): previous 0.4%, forecast 0.3%
U.S. Personal Spending m/m (August): previous 0.5%, forecast 0.5%
U.S. Revised UoM Consumer Sentiment (September): previous 55.4, forecast 55.5
U.S. Revised UoM Inflation Expectations (September): previous 4.8%,
FOMC Member Speeches: Barkin, Bowman, Daly


EUR/USD

The euro holds steady as traders await the U.S. inflation data, which could either strengthen the dollar or extend its recent hesitation. Sentiment remains fragile with Washington’s fiscal tensions still unresolved, while investors look for clues in eurozone data to gauge the bloc’s growth prospects.


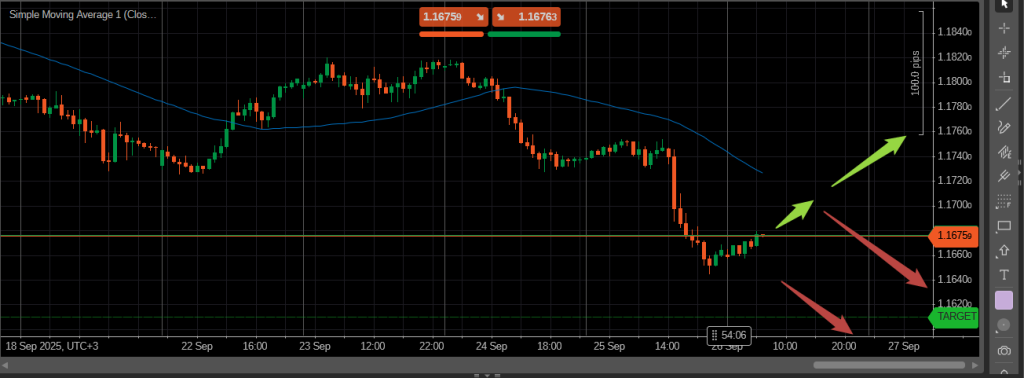
Yesterday it was a nice downsidem but today the price stalled. The sell zone is at 1.1640-1.1630. Also, in case of the SMA50 test, look for reversal signals to sell or a breakout to buy.
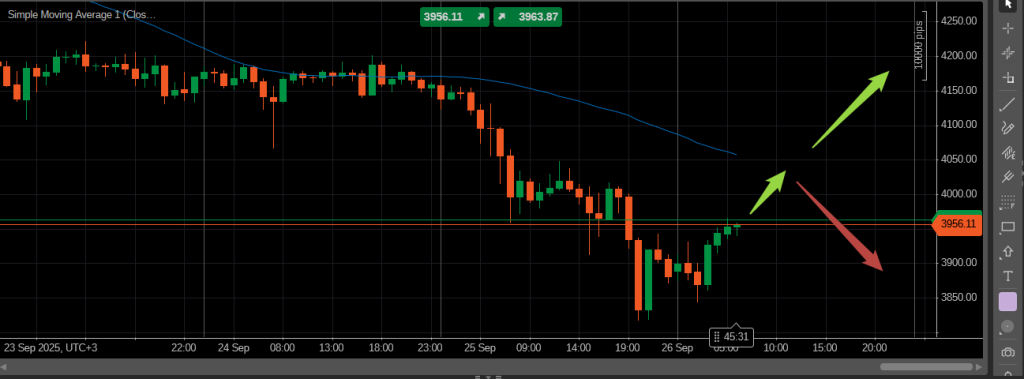
Gold

Gold trades near elevated levels as safe-haven demand persists amid U.S. political risks. Investors are cautious ahead of the PCE release, which could temporarily shift flows. Stronger inflation would weigh on gold in the short term, while softer data could provide further support.


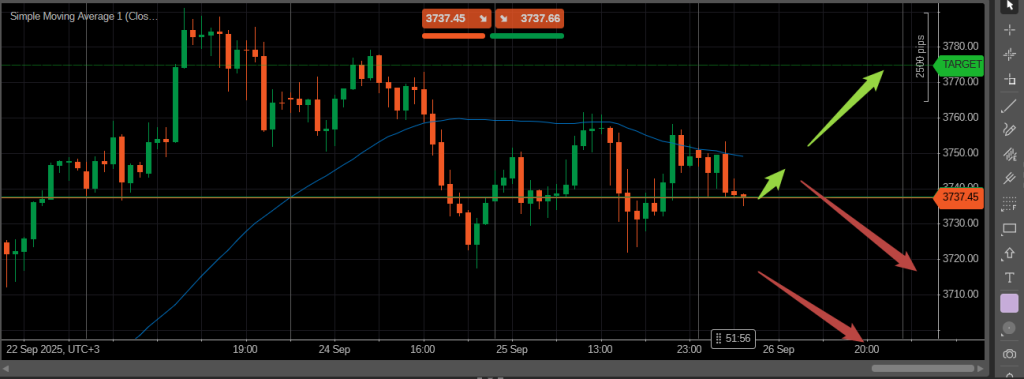
Gold is trading close to the SMA50 on the hourly chart. The sell zone for today is at 3,710-3,700. In case of the SMA50 testing, you should check reversal candlestick signals to sell. A breakout for confirmation will offer some buying opportunities.


WTI Crude Oil

Crude oil remains directionless, balancing concerns over slowing global demand with ongoing supply risks. Today’s U.S. data on consumption and inflation may offer further insight into near-term demand, potentially guiding sentiment for energy markets.


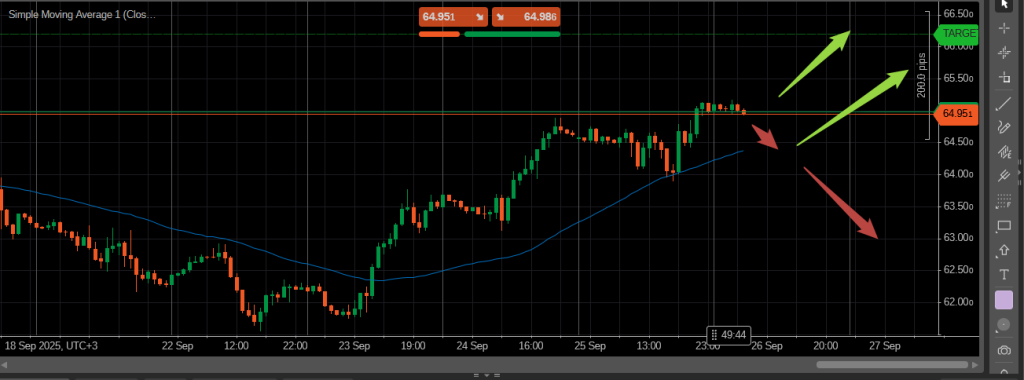
Crude oil is trading above the SMA50 on the hourly chart confirming bullish sentiment. The buy zone is at 65.30-65.40. In case of the SMA50 test, buy if you see a clear upside reversal signal. In case of a confirmed breakout, you can sell with targets according to your risk-to-reward method.


Bitcoin

Bitcoin consolidates as traders await U.S. data for cues on liquidity and risk appetite. Stronger inflation and hawkish Fed expectations could dampen sentiment, while weaker prints might encourage fresh inflows into digital assets.


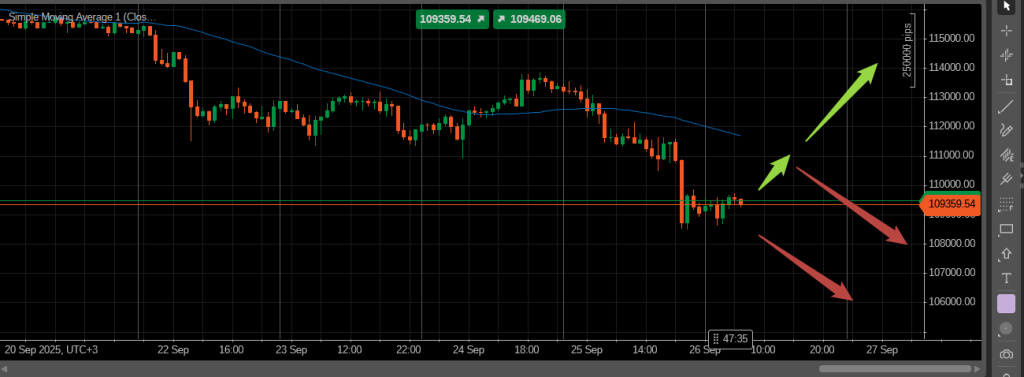
Bitcoin is trading below the SMA50 on the hourly chart confirming the bearish market sentiment. The sell zone is at 108,300-108,000. Also, in case of the SMA50 testing with a bearish reversal signal, you can sell from there. A clear and confirmed breakout of the SMA50 will open buying opoprtunities.


Ethereum

Ethereum follows Bitcoin’s cautious stance, with investors watching macro indicators for direction. Institutional flows provide some resilience, but the market is lacking a decisive catalyst until U.S. data is out and digested.


Ethereum is trading below the SMA50 on the hourly chart, which signals the bearish domination. I would wait for ETH/USD to test the SMA50 and sell if a reversal signal occurs. Also, in case of a breakout with confirmation, I would buy.


Benefit from your trading ideas now!

Join FXPro, one of the most reliable and trustworthy brokerages with European license now and capitalize on price fluctuations

0 Comments

Leave a Comment