When I first started diving into candlestick analysis, I kept coming across this strange candle that looked almost like a mistake on the chart. A thin line with almost no body,it didn’t scream “buy” or “sell” the way a bullish engulfing or hammer does. At first, I brushed it off as irrelevant noise. But the more time I spent with charts, the more I noticed that this so-called Doji candlestick often appeared at moments when the market was about to change direction, or when price was hesitating before its next big move.
The Doji became one of those patterns that taught me not to underestimate the “quiet” signals in trading. It doesn’t tell me what will happen next with certainty, but it tells me one of the most important things: the market is undecided. And in trading, understanding hesitation can be just as powerful as spotting momentum.
What Is a Doji in Trading?
A Doji candlestick forms when the opening price and the closing price are almost the same. That’s why the candle body looks like a thin line, with wicks stretching above and below. In other words, buyers and sellers fought hard during that period, but neither side managed to dominate.
For me, the Doji represents balance, temporary, fragile balance, between bulls and bears. It’s a clear sign of indecision in the market, a pause where neither side is ready to commit. And that pause is often the calm before a storm. Some traders call the Doji a “neutral candle,” and I get why. On its own, it doesn’t predict whether the next move will be up or down.
But if I place it in the right context, say, at the top of an uptrend or near a strong support zone, it suddenly transforms from neutral noise into a meaningful piece of information. That’s why I always say: the Doji by itself isn’t a trading signal, but it’s a clue. And good trading is often about collecting and reading those clues.
Different Doji Forms That I Watch Closely
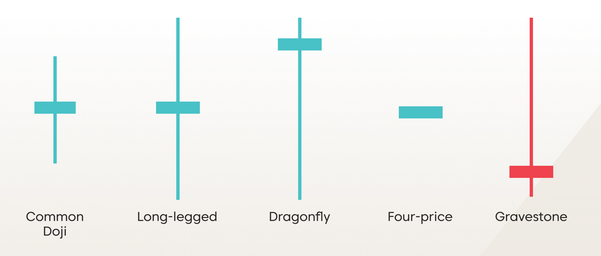
Different Doji forms can tell very different stories, and over time I’ve learned to pay attention to the subtle differences. The standard Doji is the simplest one—a tiny body with wicks above and below. On its own, it doesn’t scream buy or sell, but when it appears after a strong trend, I take notice. It’s often a sign that momentum is slowing down, and the market is pausing to decide its next move. I remember ignoring it in my early days and getting caught on the wrong side of a reversal. Now, I always consider the context before acting.
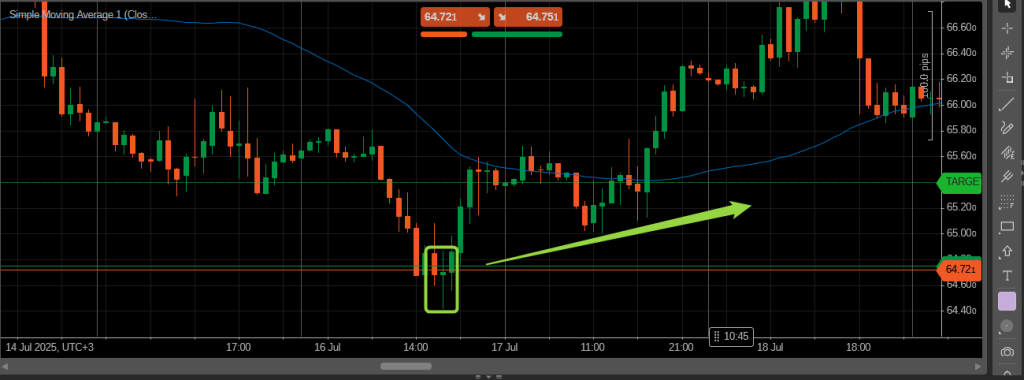
The Dragonfly Doji is one of the most interesting for me because it tends to appear at the bottom of a downtrend. Its long lower wick shows that sellers pushed the price down during the session, but buyers managed to bring it back to the opening level. For me, this often signals that buying pressure is stepping in and a reversal could be coming. I recall one trade where I spotted a Dragonfly Doji at a major support level, waited for a small confirmation candle, and entered the trade. The market bounced sharply, and I realized how powerful this tiny candle could be when interpreted correctly.
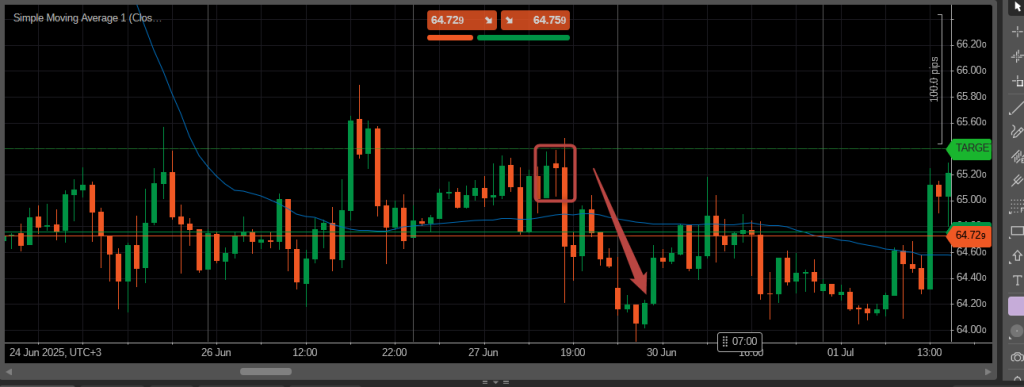
The Gravestone Doji is the opposite. I usually see it at the top of an uptrend, with a long upper wick and the close near the opening price. It tells me that buyers tried to push the price higher but failed, and sellers might be gaining strength. Early in my trading journey, I often ignored Gravestone Doji candles, thinking they were just noise. Over time, I learned to treat them as warnings—signals that it might be time to tighten stops or prepare for a potential reversal.
Then there’s the Long-legged Doji, which has long wicks on both sides. This one always catches my attention because it shows extreme indecision. Buyers and sellers battled throughout the session, but neither could take control. In my experience, these candles often appear before big, volatile moves. I’ve learned to be patient when I see a Long-legged Doji, waiting for confirmation from the next candle or from other market signals before making a decision.
Recognizing these different forms has been a game-changer for me. I don’t rely on them blindly, but combining their shape with market context, support and resistance levels, and other clues helps me read the market more accurately. A Doji might seem small or insignificant, but each variation has its own story to tell, and learning to interpret them has improved my timing and confidence in trading.
How I Actually Use Doji in My Strategy
How I use the Doji in my trading strategy has changed a lot since I first started looking at charts. Early on, I made the mistake of thinking a Doji alone was a signal to enter a trade. I would see one appear after a trend and jump in, expecting an immediate reversal. More often than not, that approach led to losses, because a Doji by itself doesn’t tell you the direction of the next move. Over time, I learned that context is everything.
Now, when I see a Doji, I first check where it appears on the chart. If it shows up at the top of an uptrend, near a known resistance level, it might indicate that buyers are losing strength. If it appears at the bottom of a downtrend, near support, it could be a hint that sellers are tiring. But I never act on that alone. I wait for the next candle or for other confirming signals, like a breakout, reversal pattern, or a shift in volume. This patience has saved me from countless false moves.
I also pay attention to the type of Doji. Dragonfly Doji near support can be a strong hint to look for a potential long position, while a Gravestone Doji near resistance tells me to watch for selling pressure. Long-legged Doji, on the other hand, always make me cautious, because they indicate the market is struggling to find direction and a big move could come in either way. I usually wait for a follow-up candle before committing to any trade.
Another tool I often combine with Doji is support and resistance. Seeing a Doji appear exactly at a strong support or resistance zone is more meaningful than seeing it in the middle of a range.
I also look at volume. A Doji with higher-than-normal volume can signal that there’s real indecision, making it more likely the next move will be significant. On the other hand, a Doji on very low volume is often just noise, and I treat it accordingly.
Over the years, I’ve realized that the Doji is less about prediction and more about awareness. It’s a clue that the market is pausing and that traders are reassessing positions. Incorporating it into my strategy has taught me patience, improved my timing, and helped me avoid impulsive decisions. For me, every Doji is a reminder that trading is not just about finding signals, it’s about understanding the story behind the price.
Common Mistakes Traders Make with Doji
I made a lot of mistakes with the Doji in the past, and I still see many traders repeating the same errors. The first mistake I made was treating the Doji as a standalone signal. I would see it at the top of an uptrend or the bottom of a downtrend and immediately assume a reversal was coming. More often than not, the market would continue in the same direction, and I would end up on the wrong side of the move. Over time, I learned that a Doji alone is just indecision, it’s not a guarantee that the trend will change.
Another common mistake is overtrading when a Doji appears. I used to chase every single Doji I saw on my charts, thinking each one was a golden opportunity. This led to fatigue and unnecessary losses. I realized that the Doji’s true value comes from context, not quantity. Now, I only pay attention when it appears at key levels or within a meaningful trend.
I also learned to be careful with Doji in volatile markets. In assets like crypto, for example, Doji can appear frequently due to price fluctuations and low liquidity periods. Early on, I would try to trade all of them, but I quickly discovered that most were just noise. I now filter Doji based on volume, trend strength, and other supporting signals before making any decisions.
Ignoring confirmation is another pitfall. A Doji tells me that buyers and sellers are in balance, but it doesn’t tell me who will win the next battle. I always wait for the next candle or additional indicators, like breakouts, support/resistance tests, or shifts in volume, to confirm what the market might do next. This extra step has saved me from a lot of losses.
Finally, I see many traders overcomplicating Doji interpretation by mixing too many indicators. While some tools can help, relying on too many signals often leads to confusion. I’ve found that keeping my approach simple, looking at Doji in context with trend, key levels, and a couple of confirmation tools, gives me a much clearer picture. Learning from these mistakes has helped me respect the Doji, use it wisely, and avoid impulsive trades.
Doji Across Different Markets
I’ve noticed that Doji behave differently depending on the market I’m trading. In Forex, they often appear during periods of low liquidity, like right before or after major sessions overlap. A Doji in that context can signal indecision, but sometimes it’s just a pause with no real follow-through. I’ve learned to combine it with trend analysis and support/resistance levels to decide whether it’s meaningful.
In the stock market, Doji can be particularly telling before earnings reports or other major announcements. I’ve seen them appear repeatedly as investors hesitate, unsure of how the market will react to upcoming news. A Doji here often warns me to tighten stops or wait for confirmation, rather than rushing into a trade.
Crypto is a different story altogether. Doji appear very frequently, sometimes several times in a single day, and not all of them are significant. Early in my crypto trading, I tried reacting to every Doji and ended up chasing false signals. Now, I filter them based on volume, trend, and key levels, only acting when I see a Doji forming at a strategic point.
Seeing the same pattern across multiple markets has taught me one thing: context is everything. The Doji itself doesn’t change, but the way I interpret it does depending on where I trade. Treating it with patience and combining it with other analysis has improved my decision-making across Forex, stocks, and crypto alike.
Advice to Traders / Final Thoughts
If I could give one piece of advice to new traders about the Doji, it would be this: don’t overvalue it, but don’t ignore it either. The Doji is not a magic signal, but it’s one of the clearest ways the market tells you it’s pausing, hesitating, or reconsidering. Treat it as a warning sign, not a guaranteed prediction.
I’ve learned that patience is key when trading Doji. Seeing one appear doesn’t mean I need to act immediately. Instead, I watch for confirmation from the next candle, volume changes, or price approaching key support and resistance levels. This approach allows me to separate meaningful Doji from noise, which has saved me from countless false moves.
Another important lesson is context. A Doji in the middle of a consolidation range may mean very little, while the same Doji at the top of an uptrend or the bottom of a downtrend can provide valuable insight. Understanding where the Doji forms, combined with the overall trend, has helped me make more informed decisions.
Finally, remember that trading is as much about reading the market’s story as it is about signals and patterns. For me, every Doji is a reminder that the market is constantly negotiating between buyers and sellers. By respecting its message, being patient, and waiting for confirmation, I’ve turned this seemingly simple candle into a valuable tool in my trading toolkit. The Doji may be quiet, but if you listen carefully, it has a lot to say.

