When I first started trading, the Hammer candlestick pattern was one of the first setups I learned, and it completely changed how I looked at charts. Simple, visual, and packed with price action clues, the Hammer is a classic bullish reversal signal that appears at the bottom of a downtrend.
In this guide, I’ll break down the Hammer candlestick explained step-by-step, from what it is and how to spot it, to how I use it in real trades. Whether you’re a beginner or looking to sharpen your skills, understanding the Hammer candlestick pattern can help you identify high-probability setups and improve your entry timing.
You’ll also learn how to trade the Hammer pattern effectively using volume confirmation, support levels, and proper stop-loss placement. I’ll share examples from my 1-hour chart setups and insights from my own experience with this powerful price action tool.
What Is a Hammer Candlestick?
If you’re new to price action, you’re probably asking: what is a Hammer candlestick, and why do traders pay so much attention to it?
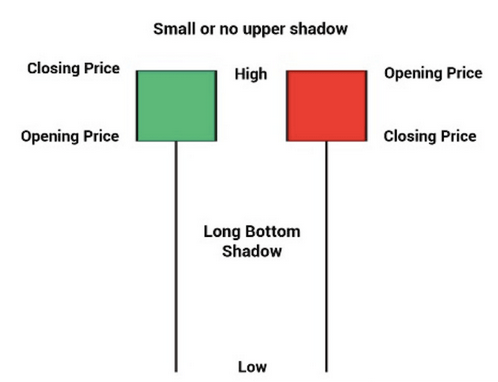
A Hammer candlestick pattern is a single-bar formation that appears after a downtrend and often signals a potential bullish reversal. It’s called a “hammer” because the shape resembles one, a small real body near the top of the candle and a long lower wick, which shows that sellers pushed prices lower during the session, but buyers stepped in and drove the price back up before the close.
Here’s how to recognize it:
-
- Small body (either bullish or bearish)
- Long lower wick (at least 2x the size of the body)
- Little to no upper wick
- Appears after a downtrend
This pattern represents a shift in market sentiment: sellers were in control early in the session, but by the end, bullish pressure won. That shift is why the Hammer candlestick pattern is so commonly used as a reversal signal, especially when paired with strong support levels or volume confirmation.
When I first started learning about candlestick analysis, this was the pattern that helped me understand price rejection and the power of momentum. It taught me that the wick isn’t just noise, it tells the story of what happened between buyers and sellers during that session.
Hammer vs Hanging Man: Don’t Get Confused
When I first started learning candlestick patterns, one of the trickiest things was telling the difference between the hammer and the hanging man. They look almost identical on the chart, but the key difference is where they appear in a trend.
The hammer appears after a downtrend and signals a potential bullish reversal. It tells us that sellers tried to push the price lower, but buyers stepped in and pushed it back up by the close. That buying pressure is what makes the pattern a possible signal for a move higher.
The hanging man, on the other hand, appears after an uptrend and can indicate a bearish reversal. The long lower wick still shows that sellers had some strength during the session, but unlike the hammer, the market context suggests that bullish momentum might be fading.
Here’s a quick summary:
-
- Hammer: Appears at the bottom of a downtrend → possible bullish reversal
- Hanging Man: Appears at the top of an uptrend → possible bearish reversal
The body and wick proportions are usually the same, so what really matters is the trend that leads into the candle. Misreading this was a mistake I made early on, and it led to trades that went against the bigger picture. Once I learned to always check the preceding trend before labeling the pattern, my accuracy improved a lot.
Bullish Hammer Pattern Confirmation: What to Look For
One of the most important things I learned about trading the hammer candlestick pattern is that you should never rely on it alone. While the pattern is visually clear and easy to spot, it’s the confirmation that truly makes it tradeable.
After a hammer appears, I always wait for a confirmation signal. This usually comes in the form of a strong bullish candle closing above the hammer’s body on the next session. That next candle tells me that buyers are continuing to step in — not just rejecting lower prices, but taking control.
Another method I use is volume. If the hammer forms on high volume, especially at a key support level, it increases the strength of the pattern. I also look at indicators like RSI or moving averages to confirm that the market may be ready to reverse.
In my own trading, I focus on the 1-hour chart. I’ve found that the hammer pattern on a 1-hour chart gives enough time for confirmation without being too slow to act on. It balances clarity and responsiveness, which suits my trading style well.
Here’s what I look for before taking action on a bullish hammer pattern:
-
- A prior downtrend
- A clearly formed hammer candle
- A bullish candle closing above the hammer’s high (confirmation)
- Increased volume during or after the pattern
- The pattern forming near a support level
Over time, I’ve noticed that hammer setups that meet all of these conditions have a much higher probability of playing out successfully.
How to Trade the Hammer Pattern: My Step-by-Step Strategy
Learning how to trade the hammer pattern gave me a much clearer process when looking for high-probability reversal setups. But it’s not just about spotting the candle — it’s about building a strategy around it.
Here’s the approach I personally use when trading the hammer candlestick pattern.
1. Identify the Trend
I always make sure the market is in a clear downtrend before the hammer forms. This is essential, because the hammer is a bullish reversal pattern — it doesn’t make sense in a sideways or uptrending market.
2. Spot the Hammer Candle
Once I see a hammer-shaped candle — small real body, long lower wick, little to no upper wick — I mark it and wait for the next move.
3. Wait for Confirmation
I don’t trade the hammer itself. I wait for a bullish confirmation candle to close above the hammer’s high. This shows that buyers are in control and gives me a clear entry signal.
4. Entry
I usually enter at the close of the confirmation candle or on a slight pullback, depending on how strong the price action looks.
5. Stop Loss Placement
I place my stop loss just below the hammer’s low. That’s the level where buyers stepped in, and if price breaks below it, I consider the setup invalid.
6. Take Profit
For targets, I look at the nearest resistance levels or use a risk-to-reward ratio of 2:1 or better.
This method has worked best for me on the 1-hour chart, where I find the signals are strong enough to act on without too much noise. I’ve also noticed that combining the hammer with support zones or moving averages increases the reliability of the trade.
Using the Hammer Pattern in Different Markets
One of the things I like most about the hammer candlestick pattern is how flexible it is. Whether I’m trading forex, crypto, or even stocks, the pattern behaves in a very similar way, though there are a few differences in how I apply it depending on the market.
Hammer Pattern in Forex Markets
In forex, the hammer pattern is especially useful during key economic sessions or after sudden drops driven by news. I’ve found that hammer setups on major currency pairs like EUR/USD or GBP/JPY can be reliable, especially when they appear near previous support zones.
However, the reliability of hammer candlestick patterns in forex markets can vary depending on volatility and the session you’re trading. I avoid hammer signals that form during low-volume times, such as late in the New York session or before major news.
When trading forex, I still rely heavily on confirmation and volume, even though spot forex doesn’t have centralized volume. I use tools like tick volume or combine with momentum indicators to increase the pattern’s effectiveness.
Hammer Pattern in Cryptocurrency Trading
In crypto trading, the hammer pattern often appears during sharp market corrections. I’ve seen some of the cleanest hammer reversals form on Bitcoin or Ethereum charts, especially during weekend volatility or after rapid dumps.
What makes crypto different is the speed of movement. I’ve learned to react a bit faster in crypto markets, but I still follow the same structure: wait for the pattern, confirm it, set my stop loss below the low, and manage the trade carefully.
Since crypto markets are 24/7 and highly emotional, hammer candles sometimes signal panic selling, followed by a quick bounce. That’s where the psychological side of this pattern really becomes clear.
Common Mistakes and Tips for Trading the Hammer Pattern
Even though the hammer candlestick pattern is simple to recognize, I’ve made plenty of mistakes trading it — and I want to help you avoid the same pitfalls.
Mistake 1: Trading Without Confirmation
One of the biggest errors I see is jumping into a trade right after spotting a hammer, without waiting for confirmation. Remember, the hammer alone is just a potential signal. Waiting for a bullish candle to close above the hammer’s high greatly improves your chances of success.
Mistake 2: Ignoring Market Context
The hammer pattern only works as a reversal signal when it appears after a downtrend. Trading it in a sideways or uptrend market can lead to false signals. Always check the trend before deciding.
Mistake 3: Poor Stop-Loss Placement
Placing your stop loss too far or too close can hurt your risk management. I recommend putting your stop just below the hammer’s low. That’s the logical invalidation point of the pattern.
Tips for Success
-
- Use the hammer in combination with support levels and volume confirmation.
- Focus on the 1-hour chart for a good balance between noise and signal clarity.
- Be patient — don’t force trades if the setup doesn’t meet your criteria.
- Practice backtesting to understand how the pattern performs in your chosen market.
By avoiding these mistakes and applying these tips, you can improve your hammer pattern trading and build more confidence in your setups.
Conclusion: Mastering the Hammer Candlestick Pattern
The hammer candlestick pattern is a powerful tool in any trader’s toolkit, offering clear signals of potential bullish reversals when used correctly. By understanding what the pattern represents, learning how to read Japanese candlesticks, and combining the hammer with confirmation signals like volume and support levels, you can improve your trading decisions significantly.
Remember to always trade with discipline: identify the trend, wait for confirmation, manage your risk with proper stop-loss placement, and be patient for the right setups. Whether you trade forex, crypto, or stocks, the hammer pattern’s simplicity and effectiveness make it a valuable pattern to master.
I’m continuously updating my blog with more insights and strategies, so stay tuned for upcoming articles that will dive deeper into other candlestick patterns and trading techniques.
If you found this guide helpful, visit my blog to explore more detailed tutorials and trading tips.


