One of the first candlestick patterns I learned to recognize on a chart was the hanging man. At the time, it seemed like just another formation, but as I gained experience, I realized how powerful it can be as a bearish reversal signal.
The hanging man appears after an uptrend and often warns that bullish momentum is starting to fade. What makes it so useful is that it packs a lot of market psychology into a single candle: buyers manage to push prices higher, but strong selling pressure brings the price back down, leaving behind a clear sign of weakness.
In this article, I’ll share how I identify the hanging man candlestick, what it tells me about trader sentiment, and the ways I use it as part of a broader trading strategy.
How I Identify a Hanging Man Candlestick
When I’m scanning charts for potential reversal signals, the hanging man candlestick is one of the candlestick patterns I always watch for. The first thing I look at is the overall trend. This candle has meaning only after a clear uptrend — without that, it’s not really a single candlestick reversal pattern.
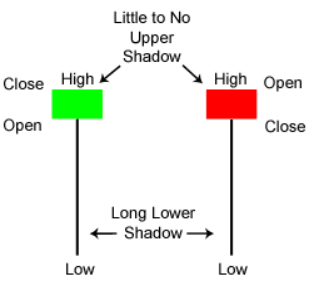
The hanging man candle itself has a very distinct look. It usually has a small real body near the top of the range, a long lower shadow that’s at least twice the size of the body, and little to no upper shadow. To me, that long lower shadow candlestick is the most important part, because it shows that sellers pushed the price down hard during the session, even if buyers managed to bring it back up before the close.
On a candlestick chart, the hanging man can look deceptively simple, but once you know what to look for, it stands out clearly. It’s a single bearish signal in trading, and I treat it as a warning sign to start paying closer attention to the price action.
Market Psychology Behind the Hanging Man
Whenever I see a hanging man candlestick after an uptrend, I don’t just look at the shape of the candle, I think about the story it tells. Candlestick patterns aren’t just random lines on a chart; they reflect real candlestick psychology and shifts in trader sentiment.
In the case of the hanging man, the session starts with buyers still in control, pushing the price higher. But then sellers step in and drag the price down sharply, leaving behind that long lower shadow. Even if buyers manage to recover some ground by the close, the balance of power has shifted. That’s why I treat the hanging man as a potential bearish reversal signal.
For me, this pattern shows a weakening bullish trend. It’s almost like the market is testing how strong the buyers really are, and the result is often hesitation or a turn to the downside. Understanding this psychology of hanging man pattern helps me decide when to be more cautious and wait for confirmation before placing a trade.
Trading the Hanging Man Candlestick Pattern
Spotting a hanging man candlestick is only the first step. In my trading, I never treat it as a guaranteed reversal on its own. Instead, I look for confirmation before making any decisions. That confirmation might come from the next candle closing lower, or from other tools I use in my analysis.
One way I apply this pattern is by combining it with indicators. For example, if the RSI is showing overbought conditions when a hanging man forms, that adds weight to the signal. The same goes for MACD divergences or strong resistance levels nearby. Using these extra tools helps me filter out false alarms and build a more reliable approach to candlestick trading.
When I use this setup, I treat the hanging man as a potential warning sign rather than an entry trigger on its own. Once I see confirmation, I might look for a short position, or at least avoid jumping into new longs. This approach turns the hanging man into part of a bigger picture, rather than a standalone hanging man trading strategy.
Examples of the Hanging Man in Real Charts
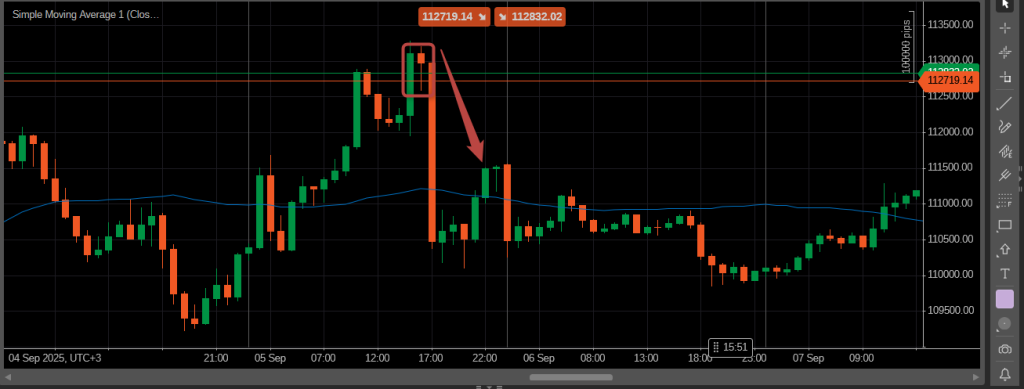
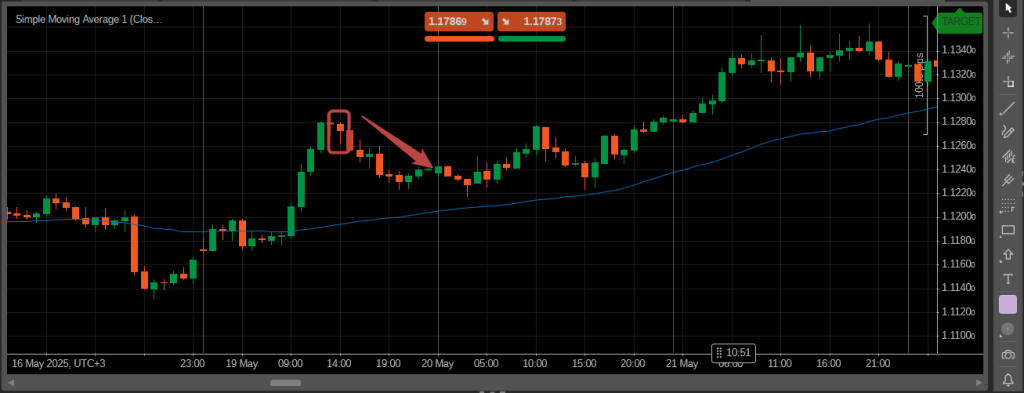
When I first started paying attention to the hanging man candlestick, I spent a lot of time going back through charts to see how it worked in practice. What I noticed is that it doesn’t matter if you’re trading forex, stocks, or even crypto, the pattern shows up everywhere.
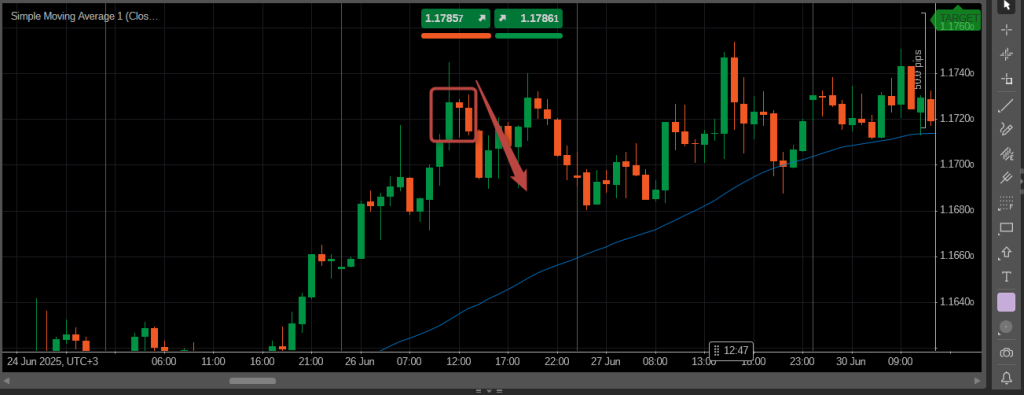
For example, I’ve spotted the hanging man on forex candlestick patterns after strong rallies in pairs like EUR/USD. Many times, the next session confirmed the weakness, leading to a clear bearish move. The same thing happens in stock trading signals, where this candle often forms right at resistance before a reversal.
I also like to keep track of how the hanging man behaves in crypto candlestick pattern setups. The moves can be more volatile, but the story the candle tells is the same: sellers stepping in at the top of an uptrend. Reviewing hanging man in forex trading and stock chart candlestick examples has helped me gain confidence in using this signal.
Looking at real or historical charts is, in my view, one of the best ways to understand how the pattern works. It’s one thing to know the definition, but seeing it play out in live markets makes it much more valuable.
Difference Between Hanging Man and Hammer
One mistake I see a lot among beginner traders is confusing the hanging man with the hammer. At first glance, they look almost identical, both have a small real body near the top, a long lower shadow, and little to no upper shadow. The difference, I’ve learned, lies in the trend they appear in.
A hanging man shows up after an uptrend and signals a potential bearish reversal. A hammer, on the other hand, appears after a downtrend and often indicates a bullish reversal. Keeping this distinction in mind has saved me from making trades based on a misread candlestick.
I also pay attention to context. Just because a candle looks like a hammer doesn’t mean it is one, if it forms after a strong upward move, it’s actually a bullish hammer pattern in reverse terms. Understanding these nuances, along with looking at opposite candlestick signals, has made my trading more precise and reduced false entries.
Limitations of the Hanging Man Pattern
Over time, I’ve learned that the hanging man candlestick is a useful signal, but it’s far from foolproof. One of the biggest mistakes I see traders make is acting on a hanging man without waiting for confirmation. Sometimes the market just continues its uptrend, and the candle turns out to be a false signal.
That’s why I always combine the hanging man with other tools, like support and resistance levels, RSI, or MACD. This helps me filter out the reliability of the hanging man candlestick and avoid jumping into trades too early. Even with confirmation, I treat it as a warning rather than a guarantee — risk management is still key.
I also pay attention to volume and overall market context. A hanging man that forms on low volume is much less meaningful than one that shows up when trading activity is high. Understanding these limitations has made me more disciplined and confident when using candlestick patterns in my strategy.
Conclusion: How I Use the Hanging Man in Trading
The hanging man candlestick has become one of my go-to signals for spotting potential reversals. I don’t treat it as a guarantee, but it’s a strong warning that bullish momentum might be weakening. Over the years, I’ve learned to always wait for confirmation and to combine it with other tools like RSI, MACD, and key support or resistance levels.
What I like most about the hanging man is that it tells a story about trader sentiment in just a single candle. Seeing buyers push the price up, only for sellers to step in, helps me anticipate possible market shifts before they become obvious.
For me, the key takeaway is this: the hanging man is most valuable when used as part of a bigger trading strategy. It’s a signal, not an order, and respecting its limitations while watching the price action closely has improved my trading results.


