Support and resistance are among the most fundamental concepts in technical analysis, forming the backbone of nearly every trading strategy. Whether you are trading forex, stocks, commodities, or cryptocurrencies, understanding how price reacts to these key levels can significantly improve your decision-making.
Support represents a price area where demand outweighs supply, often leading to a bounce or pause in a downtrend. Resistance, on the other hand, is where selling pressure overcomes buying interest, frequently halting or reversing an uptrend. By learning to read these levels on a chart, traders can anticipate potential turning points in the market and identify high-probability trading opportunities.
The beauty of support and resistance lies in their versatility: they apply across different timeframes and market conditions, and they work well in both trending and ranging environments. Traders use them in combination with price action, chart patterns, and breakout or reversal strategies to build a more reliable approach.
Understanding Support
Support is a price level or zone where an asset tends to find buying interest strong enough to prevent the market from falling further. In other words, it is the area on a chart where demand outweighs supply, often creating a “floor” that holds price up. When the market approaches a support level, traders watch closely to see if the price will bounce or break through.
The existence of support is not just a technical phenomenon but also a psychological one. Many traders and investors remember previous lows and see them as attractive entry points, which increases buying pressure. Institutional players may also step in at these levels to accumulate positions, further reinforcing the area.
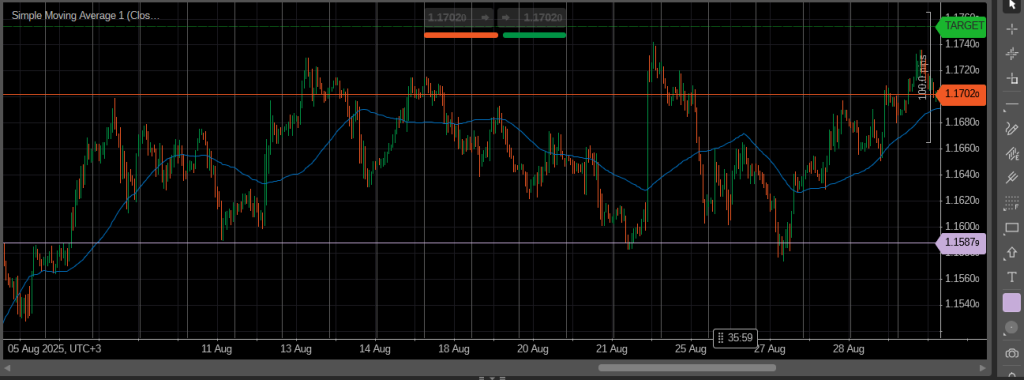
For example, in forex trading, the EUR/USD might consistently bounce near the 1.1590 level, suggesting strong demand around that price. In stock markets, a company’s shares could repeatedly find support near a round number like $50, which acts as a psychological barrier.
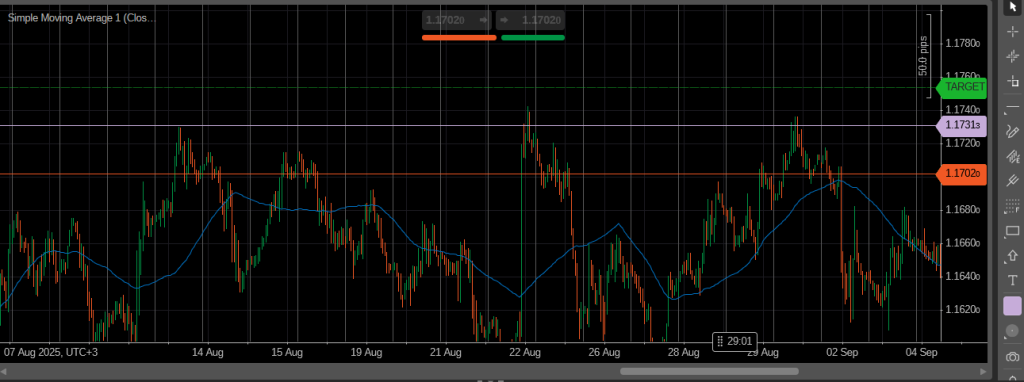
Support can be static or dynamic. Static support remains fixed, such as a historical low, while dynamic support changes over time, often represented by tools like moving averages or trendlines. Both types are valuable for traders who aim to predict where price may stop declining and potentially reverse.
Understanding Resistance
Resistance is the opposite of support. It represents a price level or zone where selling pressure is strong enough to prevent the market from moving higher. In simple terms, resistance acts as a “ceiling” on a chart, where supply outweighs demand, often stopping an uptrend or triggering a reversal.
Just like support, resistance has both technical and psychological dimensions. Traders remember previous highs as difficult areas to break, and sellers often step in at these points to take profits or open new positions. Institutional investors may also use resistance levels to reduce exposure, which reinforces the barrier.
For instance, in stock trading, a share price might struggle to move beyond $100, with each attempt being pushed down by sellers. In cryptocurrency markets, Bitcoin could face resistance near a previous all-time high, where traders hesitate to buy further due to uncertainty or fear of overvaluation.
Resistance can be horizontal, such as a well-defined price high, or dynamic, like a descending trendline that follows the price downward. Identifying resistance correctly helps traders avoid buying into weak markets and prepares them for potential breakout or reversal opportunities.
How to Identify Key Levels
Recognizing support and resistance on a chart is one of the most important skills for traders. These levels are not always precise lines but often appear as zones where price reacts repeatedly. The more times a level has been tested without being broken, the stronger it becomes in the eyes of market participants.
One of the simplest methods is to use historical highs and lows. By looking at previous turning points, traders can mark out areas where price struggled in the past, expecting similar behavior in the future. Horizontal lines across these zones often serve as a visual guide for decision-making.
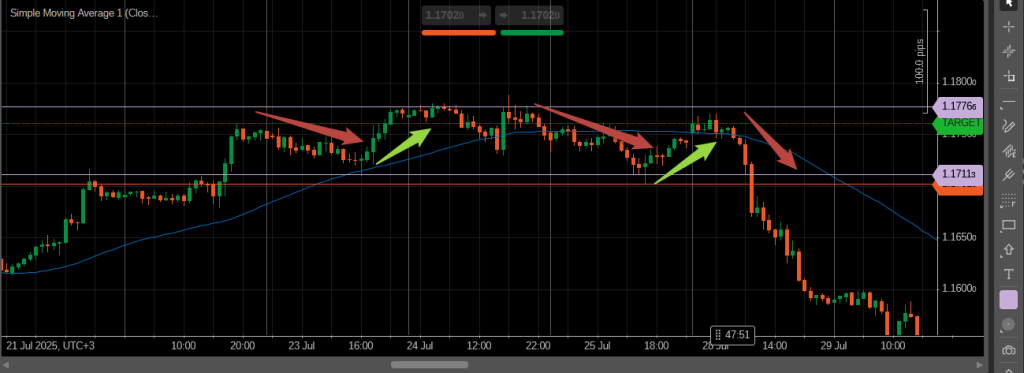
Trendlines are another valuable tool. By connecting consecutive lows in an uptrend or consecutive highs in a downtrend, traders create dynamic support and resistance levels that evolve with the market. These lines can act as guides for entry and exit points.
Volume also plays a critical role. When price reacts near a level with high trading volume, it signals that many participants agree on its importance, increasing the likelihood of that level holding in the future. This makes volume a powerful confirmation tool when identifying key zones.
By combining historical price action, trendlines, and volume analysis, traders can map out strong areas of interest where the market is more likely to stall, reverse, or break out with momentum.
The Role of Support and Resistance in Trading Strategies
Support and resistance are not just theoretical concepts; they form the basis of practical trading strategies across all markets. Traders use these levels to plan entries, exits, and risk management in a structured way.
One of the most common methods is range trading, where price moves between a defined support and resistance. In this case, traders buy near support and sell near resistance, profiting from repeated oscillations within the range. This approach is particularly effective in sideways or consolidating markets.
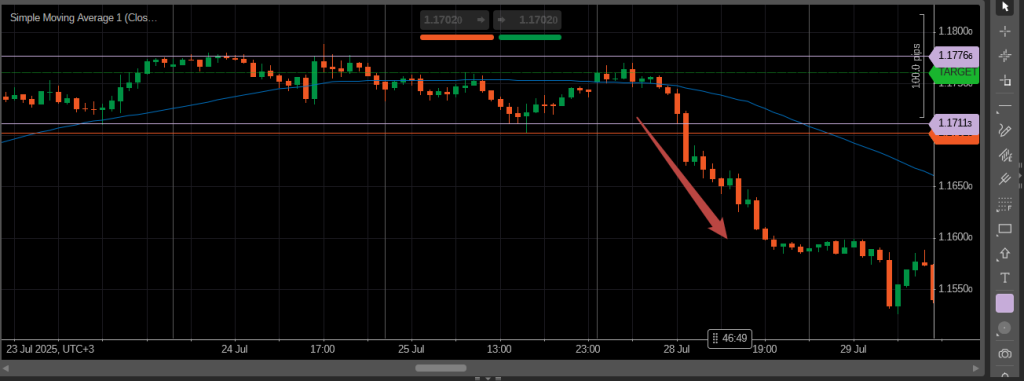
Another widely used method is the breakout strategy. When price finally breaks above resistance or below support, it often signals strong momentum in that direction. Traders enter positions anticipating a sustained move, while also being cautious of false breakouts, which can trap the unwary.
Reversal setups are also powerful. Instead of waiting for a breakout, traders watch for price rejection signals, such as candlestick patterns or divergences with indicators, near key levels. This allows them to trade in the opposite direction of the failed move, often with a favorable risk-to-reward ratio.
In all these strategies, proper use of stop-loss and take-profit orders is crucial. By placing stops beyond support or resistance zones, traders protect themselves from unexpected breakouts, while profit targets allow them to secure gains when price reaches the next logical level.
Common Mistakes Traders Make
While support and resistance are powerful tools, many traders misuse them, leading to unnecessary losses. Understanding the most common mistakes can help avoid costly errors and improve overall trading performance.
One frequent mistake is treating levels as exact points rather than zones. Price rarely respects a single line to the pip. Instead, it often fluctuates slightly above or below before reacting. Traders who fail to allow for this “noise” may exit trades too early or misinterpret a move as a breakout.
Another issue is ignoring the broader market context. A support level in a strong downtrend may not hold, while resistance in a powerful uptrend could break quickly. Relying solely on static levels without considering the trend or momentum can lead to false confidence.
Many traders also fall victim to false breakouts. They enter immediately after price pierces a level, only to see it snap back in the opposite direction. Without confirmation from volume, candlestick patterns, or higher timeframes, breakouts can be deceptive.
Finally, a critical mistake is poor risk management. Some traders put oversized positions on levels they trust, only to face large losses if the level fails. Successful traders remember that no support or resistance holds forever and always use stop-loss orders to protect their capital.
Advanced Concepts
Support and resistance are not limited to simple horizontal lines. As traders gain more experience, they discover that markets respect dynamic and psychological levels just as much as historical highs and lows.
Dynamic support and resistance appear when price interacts with moving averages, trendlines, or channels. For example, a 200-period moving average often acts as a powerful dynamic level where price bounces or reverses. Trendlines that connect a series of higher lows or lower highs also provide evolving levels that guide market behavior.
Fibonacci retracement levels are another popular tool. Traders use them to identify potential pullback zones within a trend. Levels like 38.2%, 50%, and 61.8% frequently coincide with support or resistance, making them important areas to watch.
Multiple timeframe analysis can also improve accuracy. A level that is strong on a weekly chart will carry more weight than one on a five-minute chart. By aligning support and resistance across timeframes, traders can identify areas with greater significance and filter out noise.
Finally, round numbers often act as psychological barriers. Prices such as 1.0000 in forex or $100 in stocks tend to attract attention, creating natural support or resistance. These levels are watched closely by both retail traders and institutions, adding to their reliability.
Conclusion
Support and resistance remain the foundation of technical analysis and a cornerstone for effective trading strategies. By understanding how price reacts to these levels, traders can anticipate potential reversals, plan entries and exits, and manage risk more effectively.
While no support or resistance level is perfect, combining them with other tools such as price action, trendlines, volume analysis, and indicators can improve accuracy. Observing multiple timeframes and considering psychological levels further strengthens a trader’s approach.
Ultimately, mastering support and resistance is about patience, observation, and disciplined execution. Traders who respect these levels and incorporate proper risk management are better positioned to navigate market fluctuations and increase their chances of long-term success.


