Over the years, I’ve experimented with dozens of indicators and strategies, but one tool that consistently proves its value is the SMA50, the 50-period Simple Moving Average. Instead of cluttering my charts with too many signals, this single line often tells me more than most indicators combined.
I don’t see the SMA50 as just a technical tool; I treat it as a compass in trading. It shows me the bigger picture — whether the market is trending up, sliding down, or just moving sideways. In many cases, it even acts as a dynamic support or resistance level, giving me clear points to plan entries and exits. Whether I’m analyzing forex pairs, stocks, or cryptocurrencies, the SMA50 is usually the first thing I check before making a decision.
What the SMA50 Really Is and Why It Matters
The first thing the SMA50 shows me is clarity. One quick glance, and I know if the market is trending up, trending down, or stuck in a sideways chop. That smooth line is just the average of the last 50 closing prices, but it has a way of cutting through all the noise and revealing the true direction of the market.
Here’s why it matters: if the price is trading above the SMA50, buyers are clearly in control — I treat it as dynamic support. When the price is below, sellers dominate, and the line often works as dynamic resistance. And when the price crosses it? That’s when I get ready, because it usually signals a shift worth paying attention to.
What I love most about the SMA50 is its balance. It’s not too fast like the SMA20, which often throws out false signals, and not too slow like the SMA200, which reacts only after the big move has already happened. The SMA50 hits that perfect middle ground — quick enough for swing trades, reliable enough for longer setups.
How I Use the SMA50 to Spot Trend Direction
The SMA50 is my go-to tool for answering the simplest but most important question in trading: “Who’s in control — buyers or sellers?” If the price is consistently trading above the SMA50 and the line itself is sloping upward, I treat the market as being in a bullish trend. That’s my signal to focus on buy setups — waiting for pullbacks toward the moving average to catch the next wave higher. On the other hand, if the price stays below the SMA50 and the line points downward, that’s a clear bearish trend, and I shift my attention to selling opportunities.
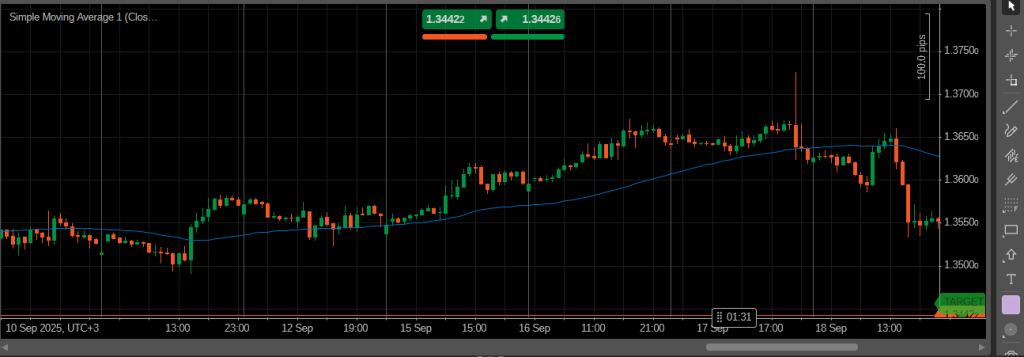
What really makes the SMA50 stand out is how it behaves like dynamic support and resistance. In an uptrend, it often acts as a soft floor. Price may dip, touch the SMA50, and bounce right back up — a confirmation that buyers are protecting that level.
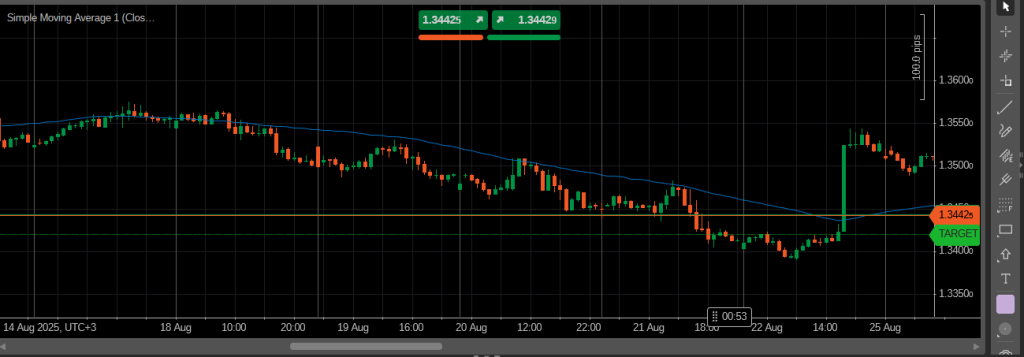
In a downtrend, the story flips. The SMA50 becomes a ceiling, capping any attempts to move higher and pushing price back down into the trend. I’ve seen this play out on all timeframes, from hourly scalping charts to daily swing setups.
But the real excitement comes when the price starts messing with the SMA50. A clean break and close through the line often signals a potential trend reversal. Of course, not every cross is the start of a new trend, some are just false signals in choppy, sideways markets. That’s why I always wait for a bit of confirmation, like price holding above or below the SMA50 for several candles, before jumping in.
Another trick I’ve picked up is combining SMA50 slope with market structure. If the moving average is flat, it’s usually a warning to stay cautious, the market is ranging, and trend-following setups lose their edge. But when the SMA50 tilts sharply and aligns with higher highs or lower lows, that’s the sweet spot. It tells me the market is trending cleanly, and that’s when the best risk-to-reward trades appear.
At the end of the day, the SMA50 gives me more than just direction, it gives me confidence. Instead of guessing where the market might go, I use it as a guide to align my trades with the dominant force, whether that’s the bulls or the bears.
How I Trade Using the SMA50
Once I’ve identified the trend with the SMA50, the next step is figuring out how to enter trades with a favorable risk-to-reward setup. One of my favorite approaches is waiting for price to pull back toward the SMA50 in a trending market. In an uptrend, I watch for dips that touch or get close to the moving average before buying. In a downtrend, I look for rallies toward the SMA50 as an opportunity to sell. Pullbacks like this often offer lower-risk entry points and a better chance for the trade to move in my favor.
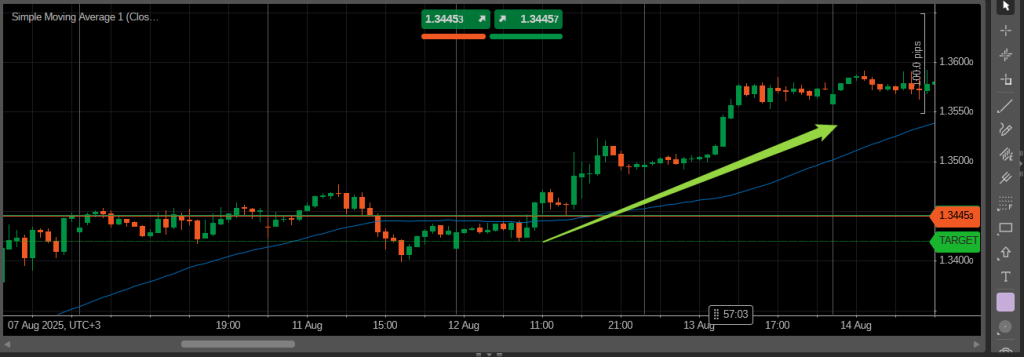
I also focus on breakouts and reversals around the SMA50. When price breaks strongly above the SMA50 in a bullish move or below it in a bearish move, I treat it as a potential breakout trade. These moves often indicate that the market is gaining momentum in the direction of the trend, and entering at the right moment can capture significant price action.
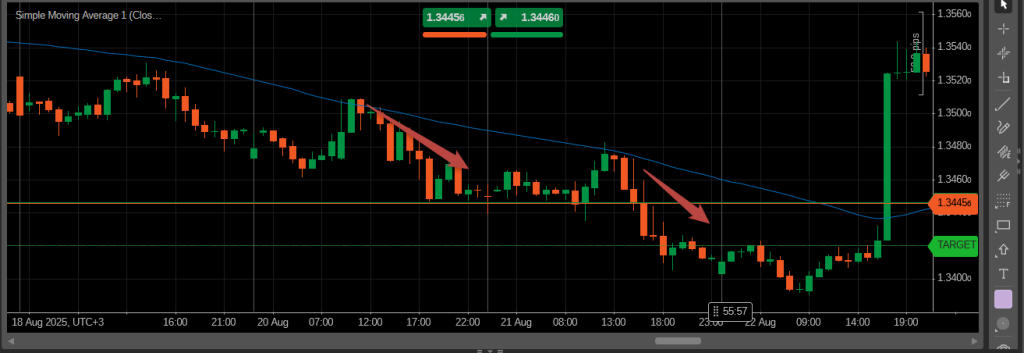
Reversal strategies are another way I use the SMA50. If price approaches the moving average after a strong trend but fails to break it convincingly, it can signal a trend reversal or correction. Watching for these failed tests and combining them with nearby support or resistance zones helps me identify when to exit a trade or even open a counter-trend position.
Positioning my stop loss just beyond the SMA50 gives me protection against sudden moves, while take profit targets are usually set at the next significant support or resistance level. By focusing on breakouts and reversals, I keep my trades aligned with the market’s momentum while managing risk effectively.
How I Use the SMA50 Without Other Indicators
For me, the SMA50 alone is usually enough to make trading decisions. I don’t rely on additional indicators like MACD or stochastic oscillators. I’ve found that observing how price interacts with the SMA50, along with reading the trend and key support or resistance levels, provides clearer signals than stacking multiple indicators that can sometimes contradict each other.
That said, some traders like to combine the SMA50 with RSI to add an extra layer of confirmation. For example, they might wait for the RSI to leave the overbought area in a downtrend or exit the oversold area in an uptrend before taking a trade.
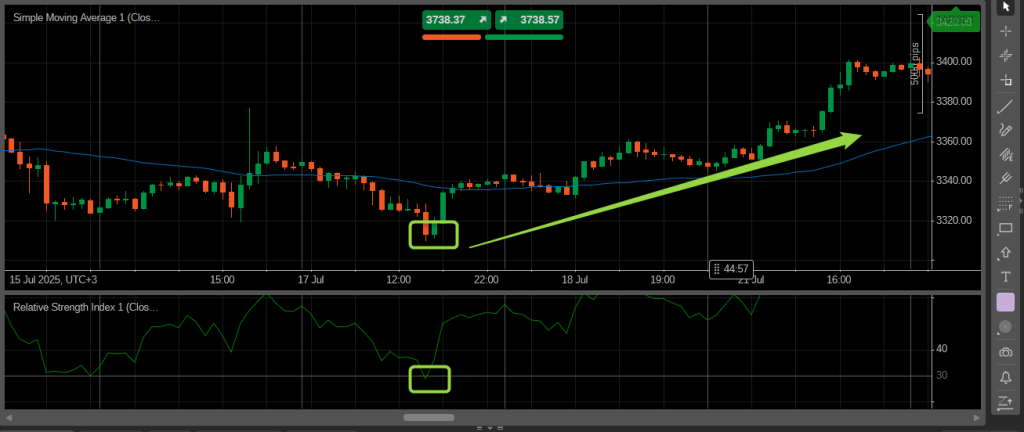
In an uptrend, if price pulls back toward the SMA50 and the RSI moves out of the oversold zone, it can indicate a strong buying opportunity.
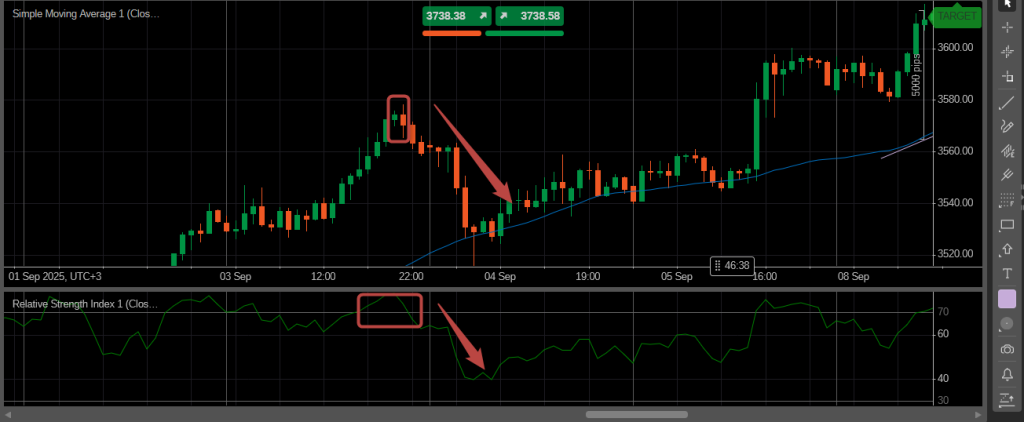
In a downtrend, if price rallies toward the SMA50 and the RSI leaves overbought territory, it can signal a good chance to sell. Using this approach can help reduce the risk of entering too early and confirm the strength of the move.
Personally, I stick mainly to the SMA50 and price action for my entries and exits, but combining it with RSI in this way is a popular strategy among traders who want extra confirmation. Watching pullbacks, breakouts, and reversals on the SMA50, possibly supported by RSI leaving extreme zones, usually gives a clear and actionable signal without overcomplicating the chart.
Risk Management and Stop Loss Placement Using the SMA50
Trading is not just about spotting trends and entries — it’s about protecting your capital. When I use the SMA50, I always plan my stop loss placement around key levels. In an uptrend, I usually place my stop just below the SMA50 or below a recent swing low. In a downtrend, the stop goes just above the SMA50 or a recent swing high. This way, if the market suddenly reverses, my losses are limited while still giving the trade room to breathe.
I also consider the size of my positions based on the distance between my entry and stop loss. By adjusting position sizing, I ensure that even if the stop is hit, I’m risking only a small, predefined percentage of my account. This keeps me disciplined and prevents emotions from interfering with trading decisions.
Another important point is patience. Sometimes price hovers around the SMA50 and tests it multiple times. Jumping in too early can lead to being stopped out unnecessarily. I prefer to wait for a clear bounce, breakout, or reversal before committing, because it improves the risk-to-reward ratio of my trades.
Finally, using the SMA50 in combination with thoughtful stop loss placement allows me to ride trends safely, take advantage of reversals, and manage volatility without getting caught off guard. Even in choppy markets, having a structured approach around the SMA50 gives me confidence to trade consistently.
Conclusion and Final Tips for Trading with the SMA50
Trading with the SMA50 has become one of the most reliable parts of my routine. It helps me see the trend clearly, identify dynamic support and resistance levels, and make more confident trading decisions. By focusing on pullbacks, breakouts, and reversals, I can find opportunities with a good risk-to-reward ratio without overcomplicating my charts.
One of the key lessons I’ve learned is to trust the price action around the SMA50. Waiting for a bounce or a breakout, rather than rushing into trades, makes a huge difference. Using proper stop loss placement and managing position size ensures that even if a trade goes against me, the impact on my account is minimal.
While some traders like to add indicators like RSI for extra confirmation, I personally rely mostly on the SMA50 and market structure. Keeping it simple often leads to the clearest signals and reduces confusion. For anyone starting to use the SMA50, I recommend observing how the price reacts to it on different timeframes, testing breakout and reversal setups, and practicing patience.
At the end of the day, the SMA50 is more than just a moving average. For me, it’s a guide that helps me align with market momentum, manage risk effectively, and trade with confidence. The key is consistency, patience, and learning to read the market through this single, powerful tool.


